RHIZOME COSMOLOGY

Oskar Elek
University of California in Santa Cruz

Joseph N. Burchett
New Mexico State University

Angus G. Forbes
University of California in Santa Cruz

USING A 3D PHYSARUM POLYCEPHALUM SIMULATION FOR MAPPING THE COSMIC WEB

Abstract: Rhizome Cosmology chronicles three years of interdisciplinary research effort aimed at better understanding the three-dimensional structure of the Cosmic web. Due to the principal difficulty of observing this enormous structure made up of diffuse intergalactic gas and dark matter, we have designed an unconventional approach based on a generalized 3D simulation of Physarum polycephalum ‘slime mold’. This document maps out the design choices behind our work and demonstrates the approach through visualizations of several instrumental cosmological datasets.

Keywords: 3D Physarum machine, Cosmology, Volume visualization, Stochastic transport networks

Overview

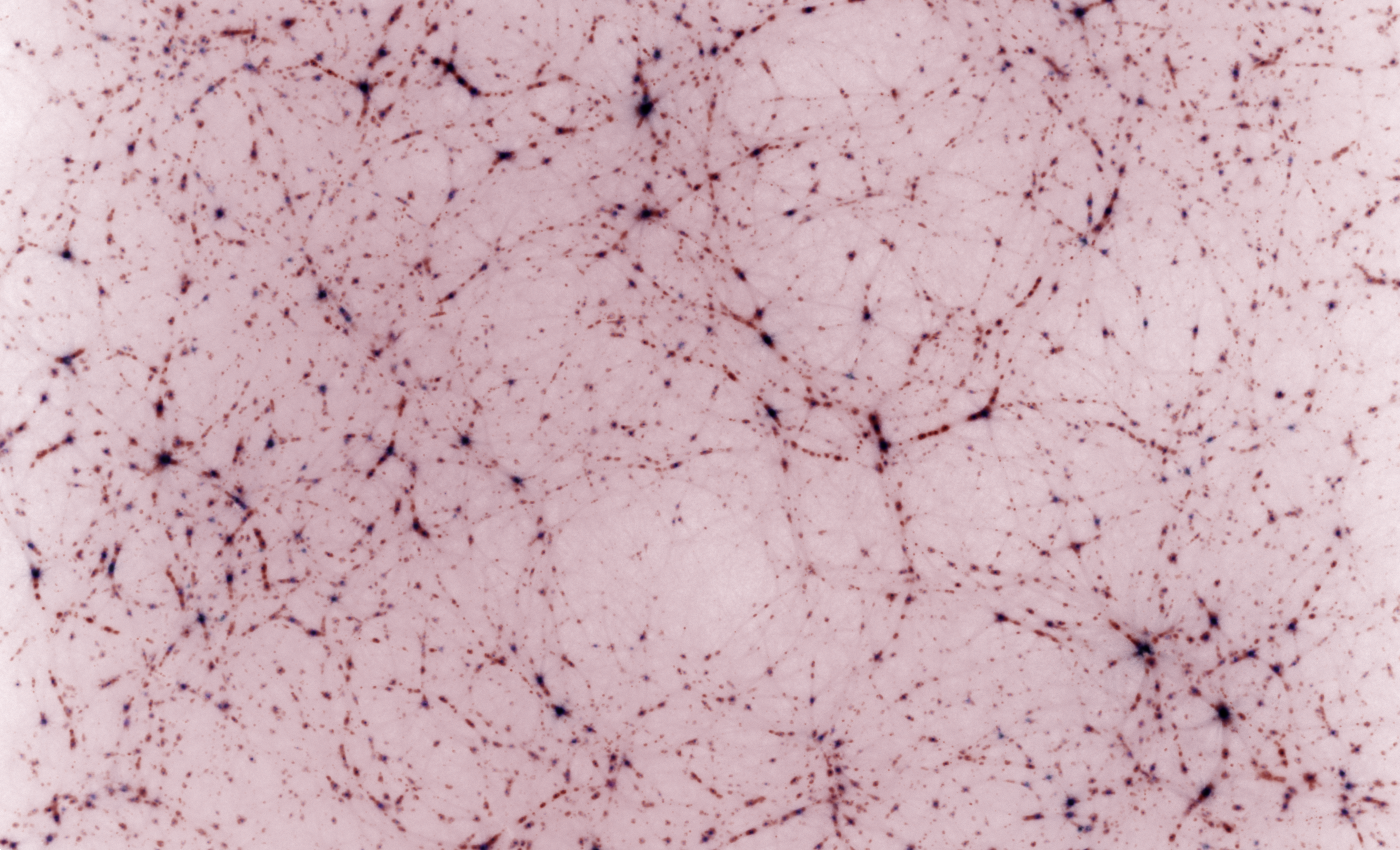
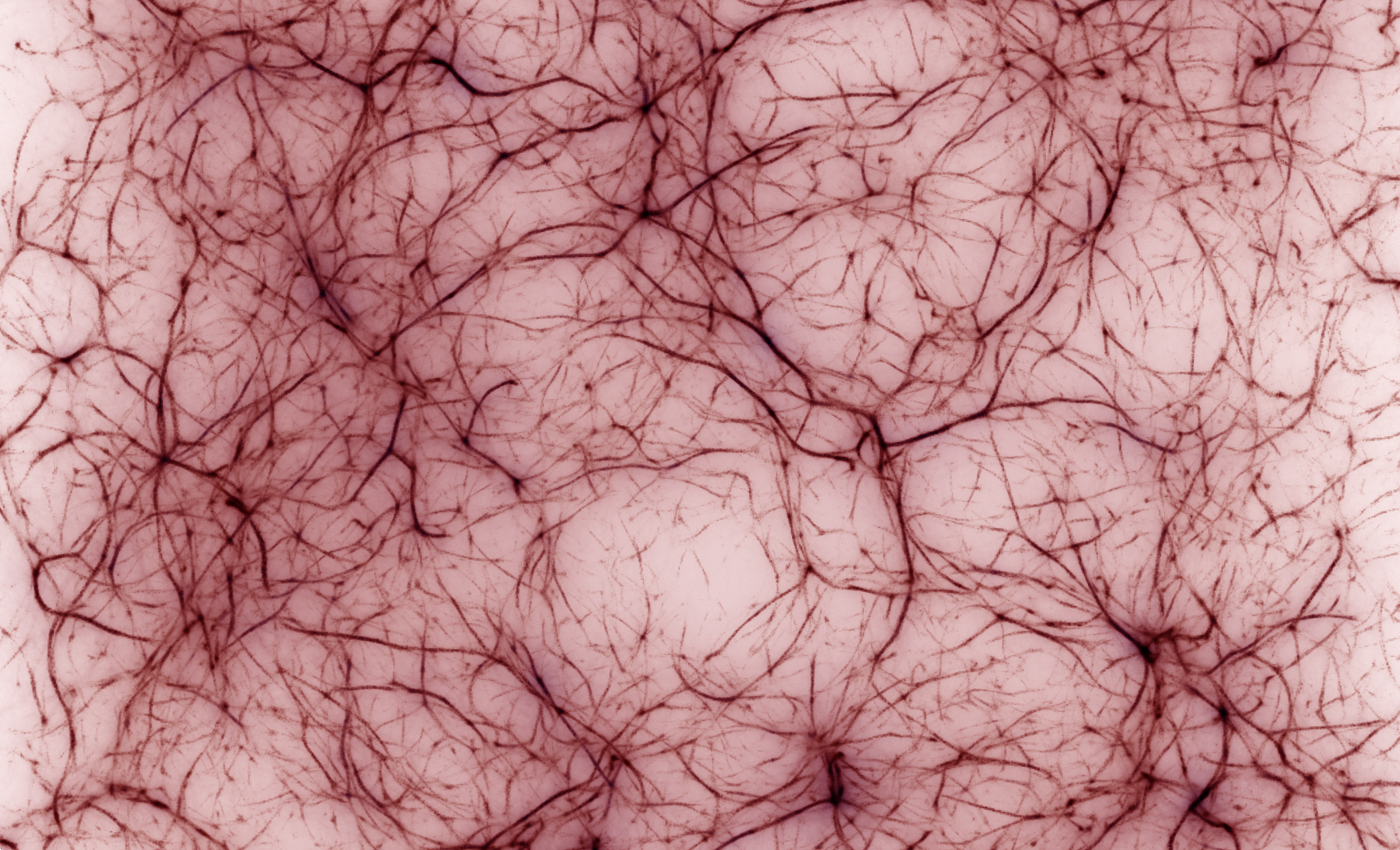
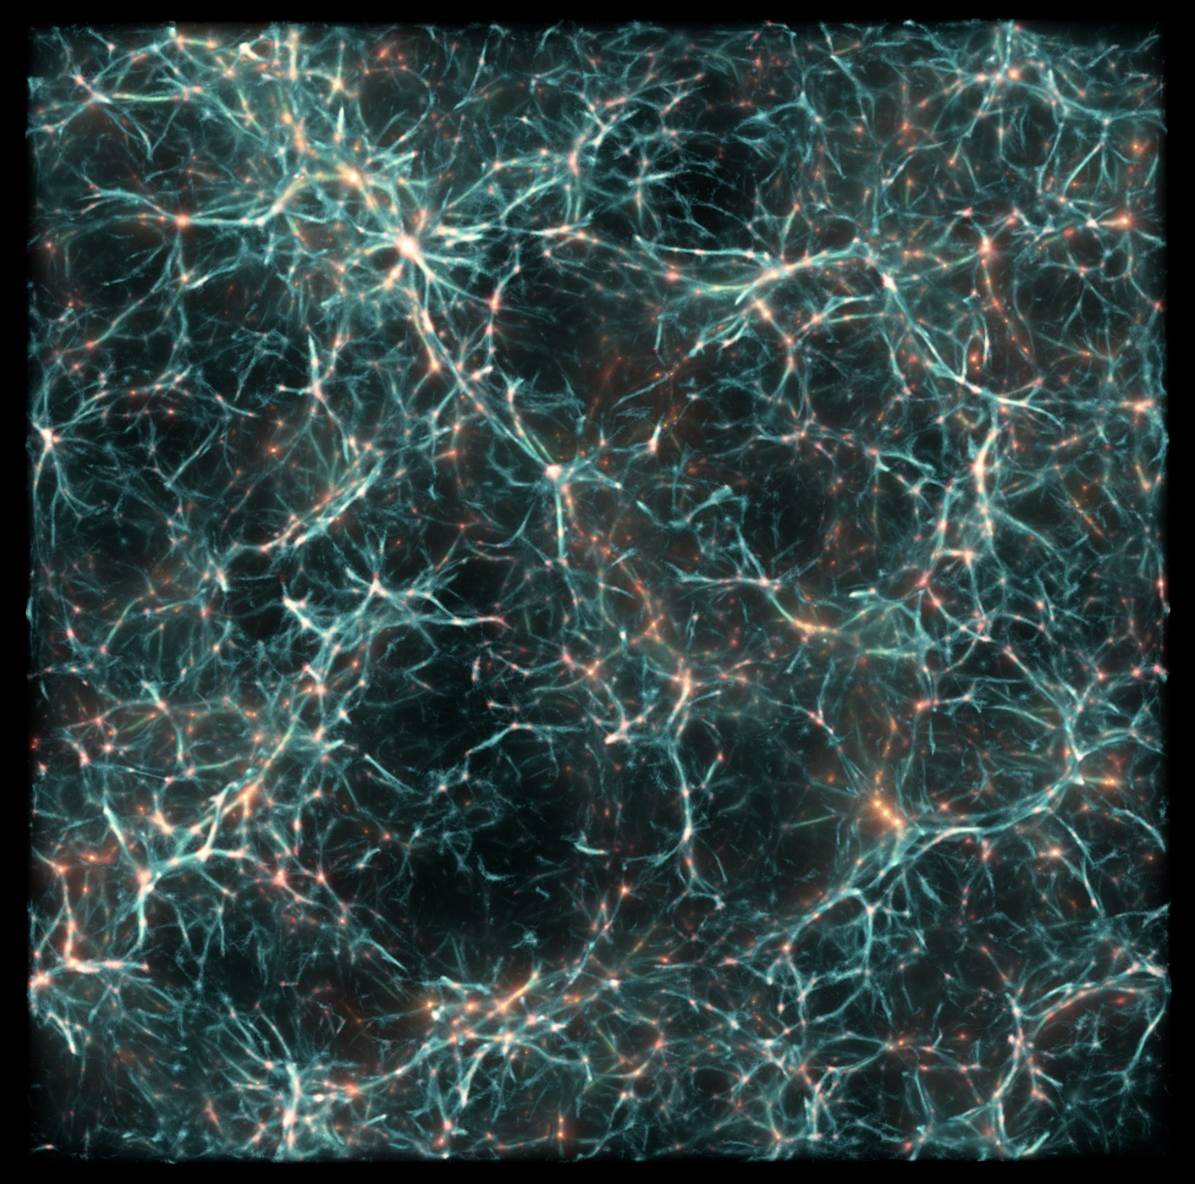
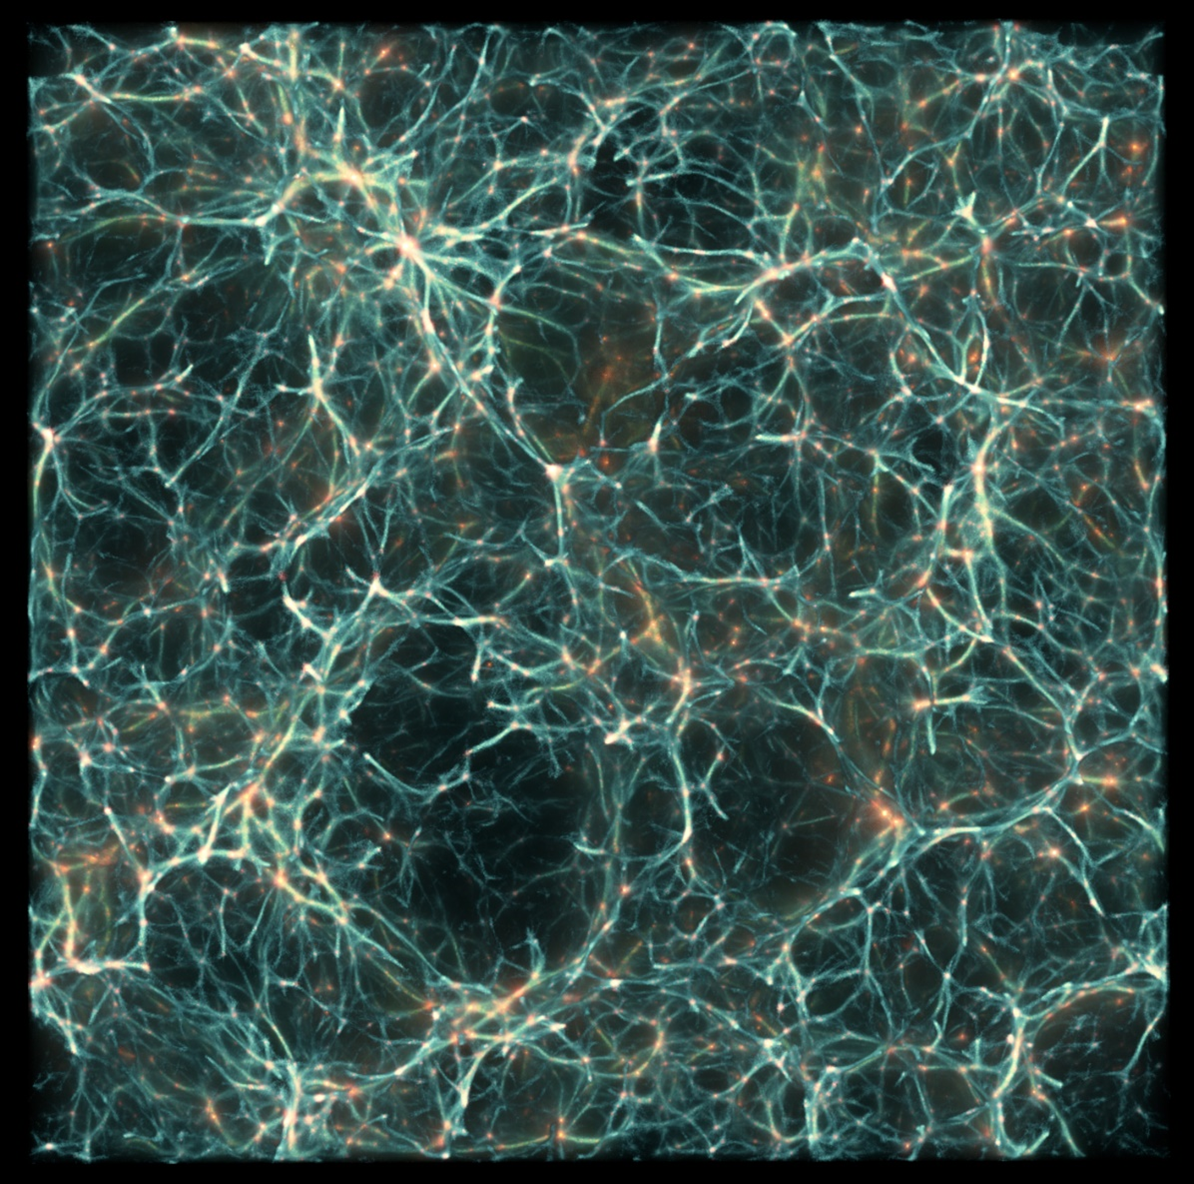
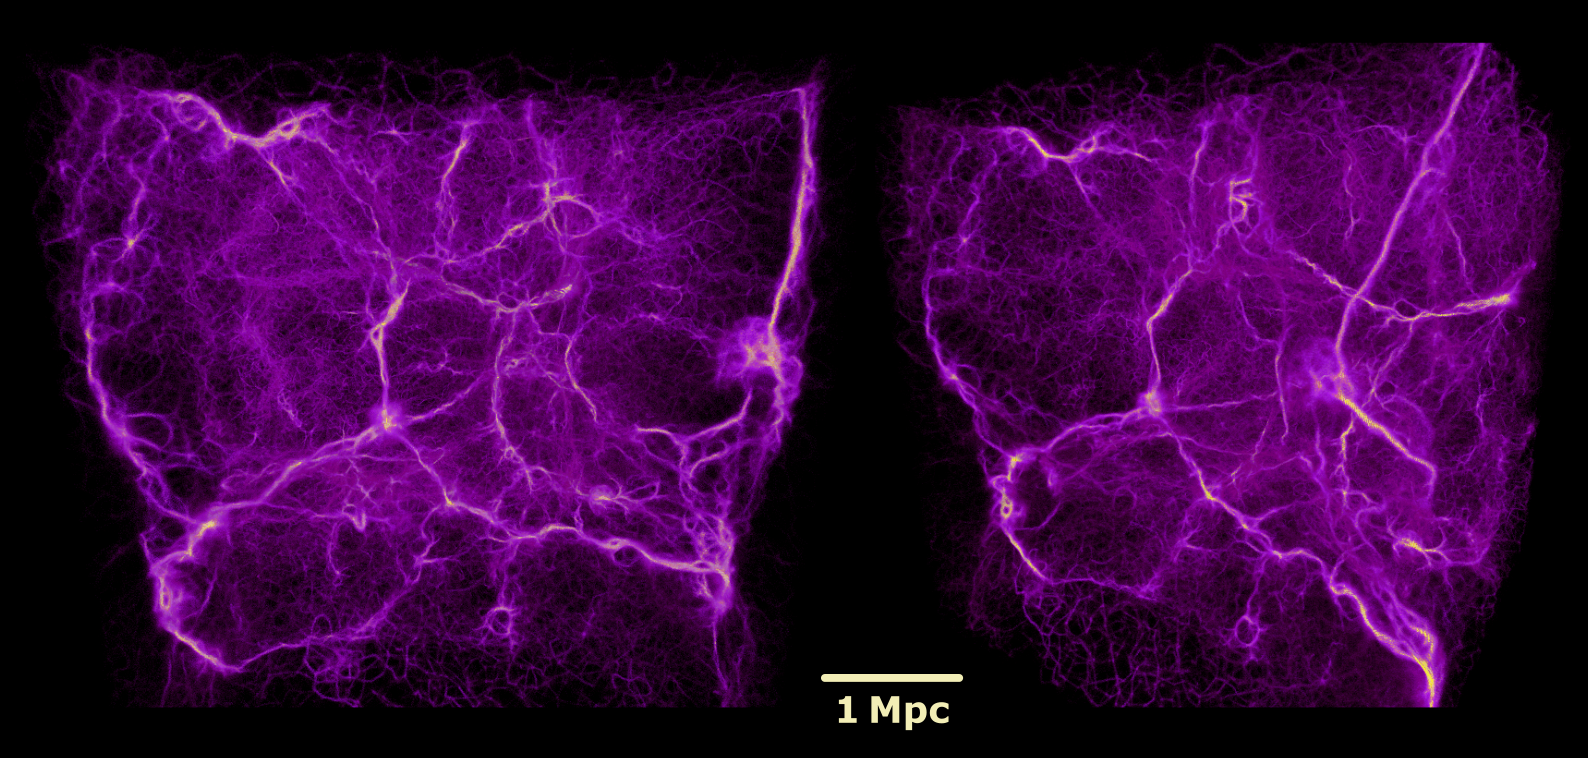
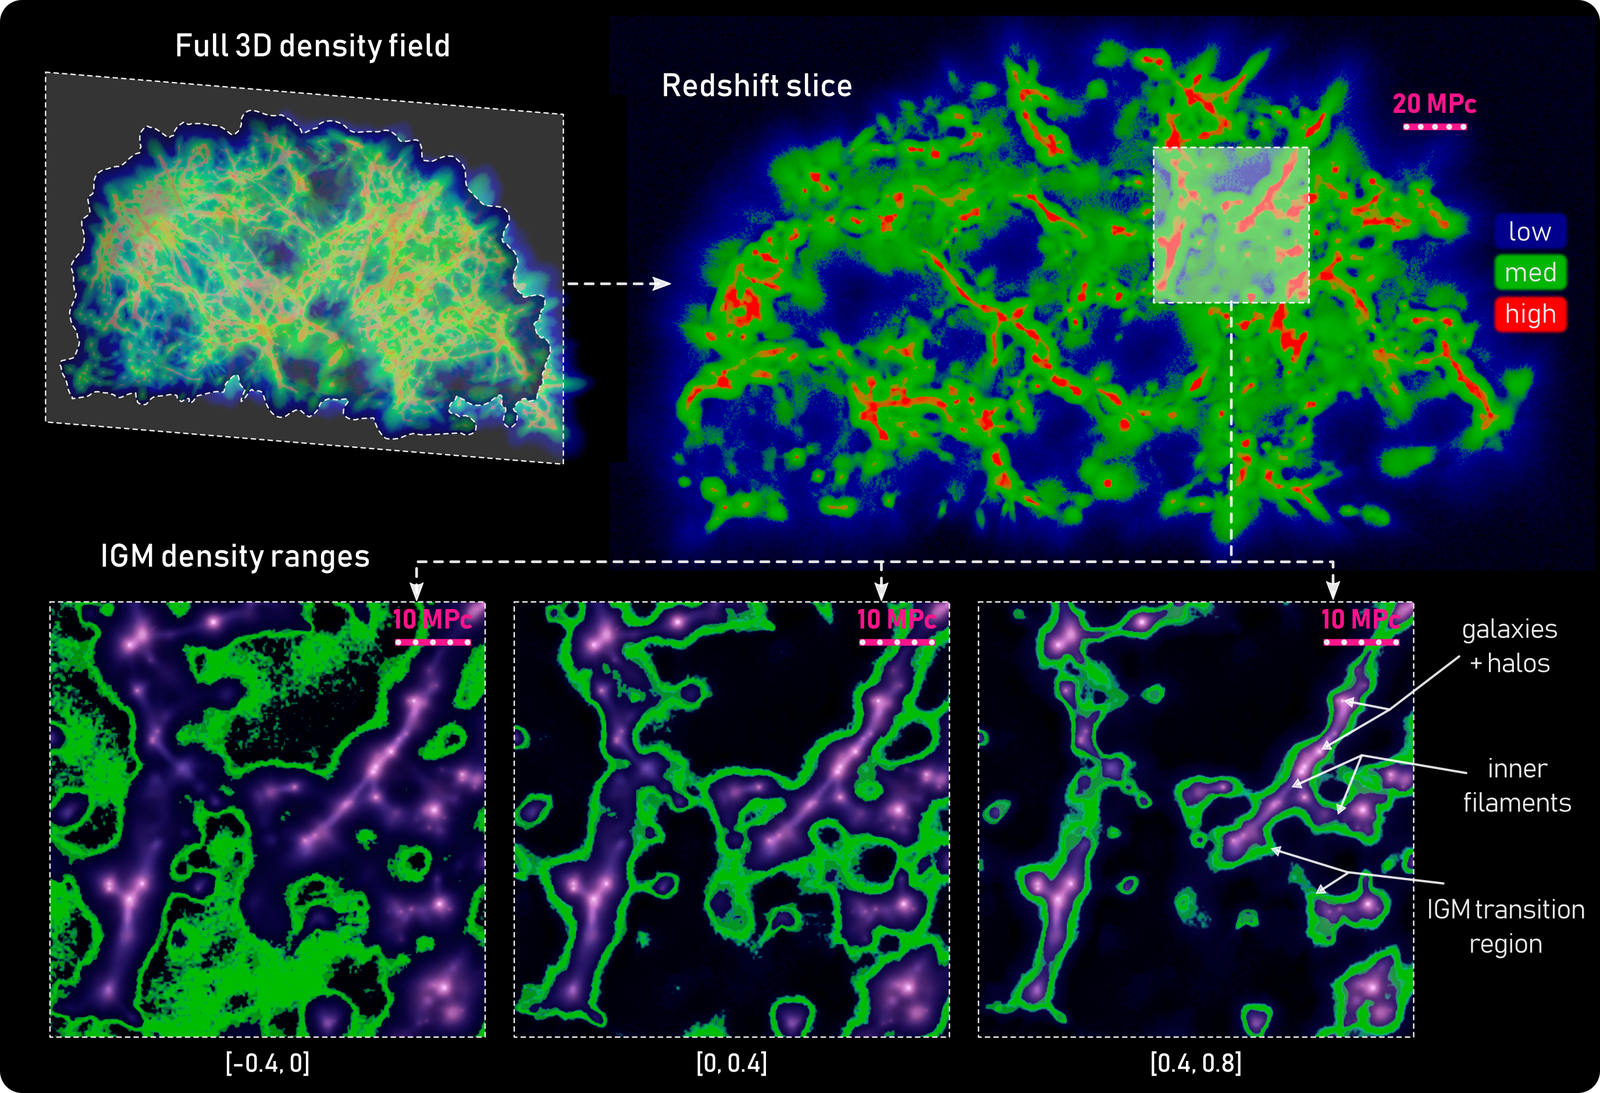
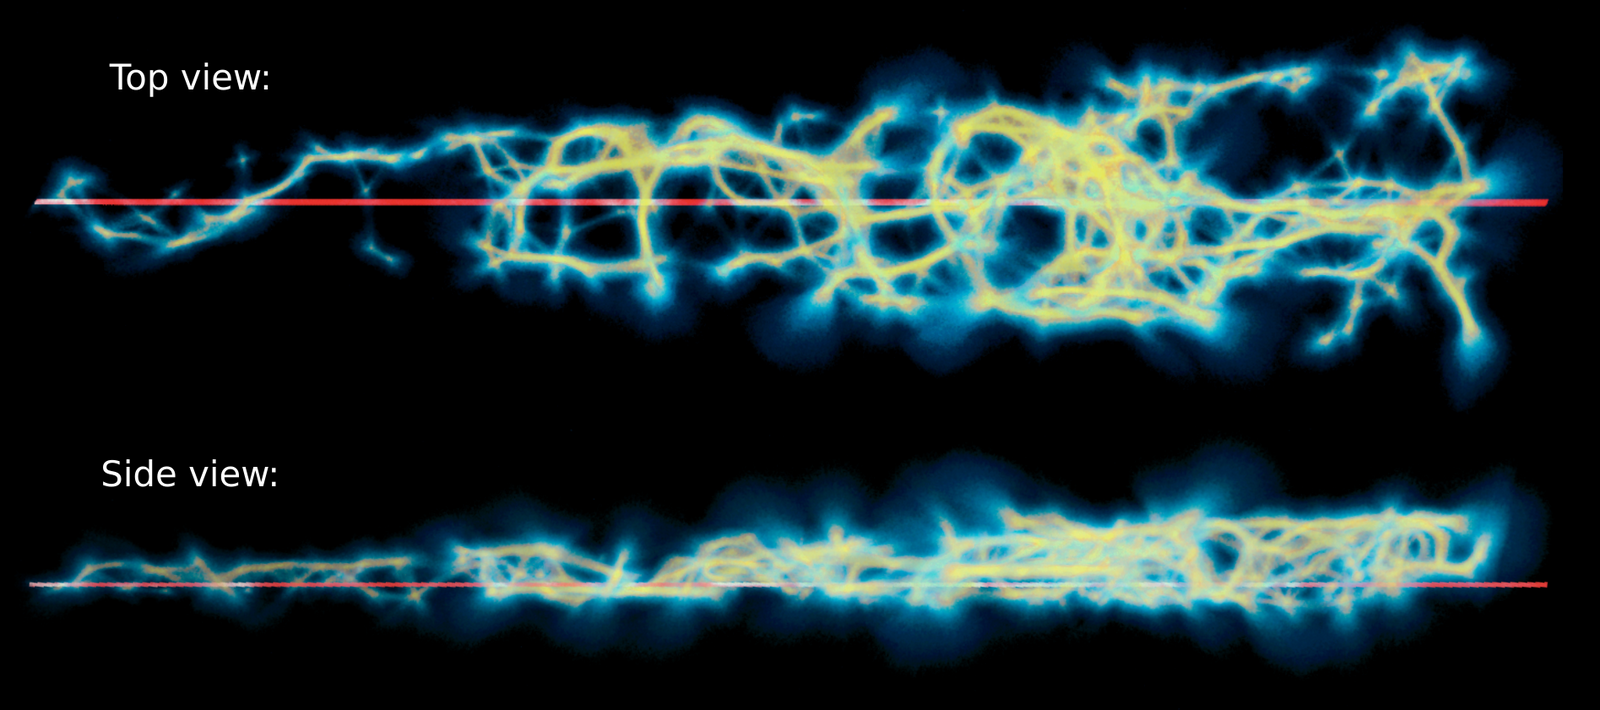
Rhizome Cosmology is made by Polyphorm, an open-source software that combines an interactive implementation of a 3D Physarum machine, and a simultaneous volume visualization of the generated structures. Polyphorm has enabled novel scientific results through its ability to create detailed 3D density maps of the Cosmic web from sparse cosmological data – catalogues of galaxies and/or dark matter halos. Our main findings include the attribution of a major portion of the intergalactic medium (IGM) to the large-scale filamentary structure of Cosmic web [Burchett2020a], and an explanation of an unusually large dispersion measure of a fast radio burst (FRB) event [Simha2021].

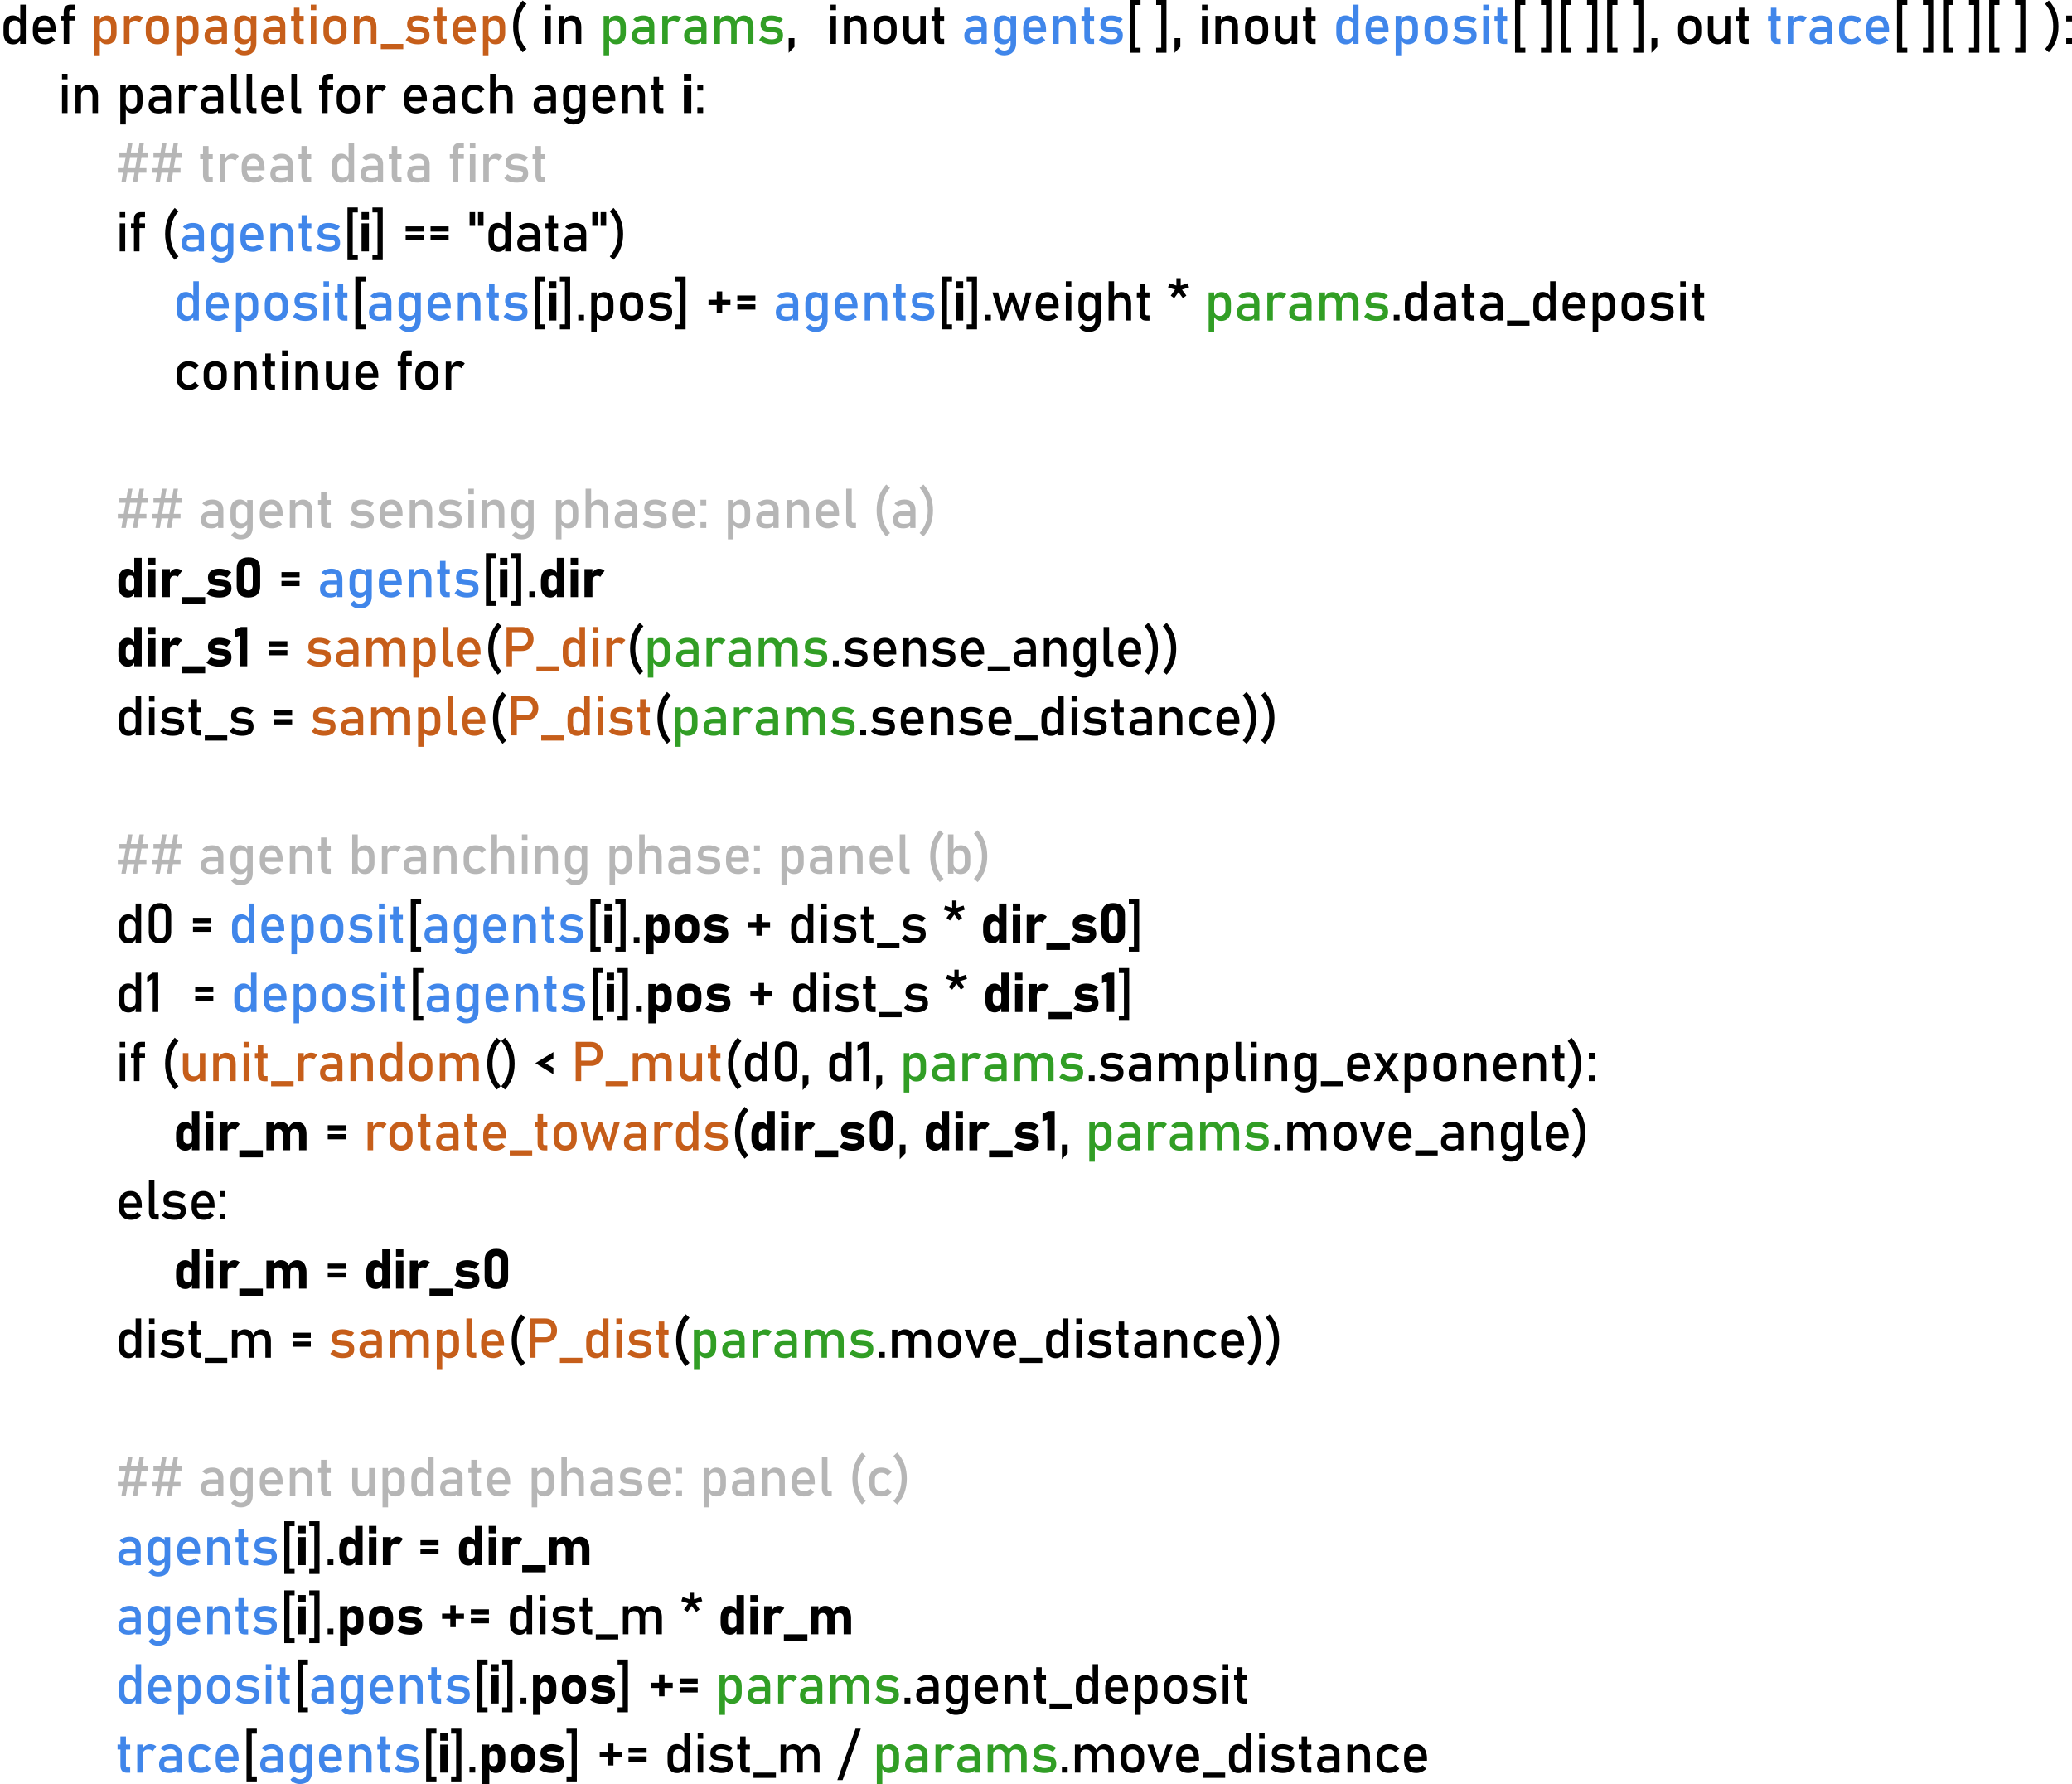
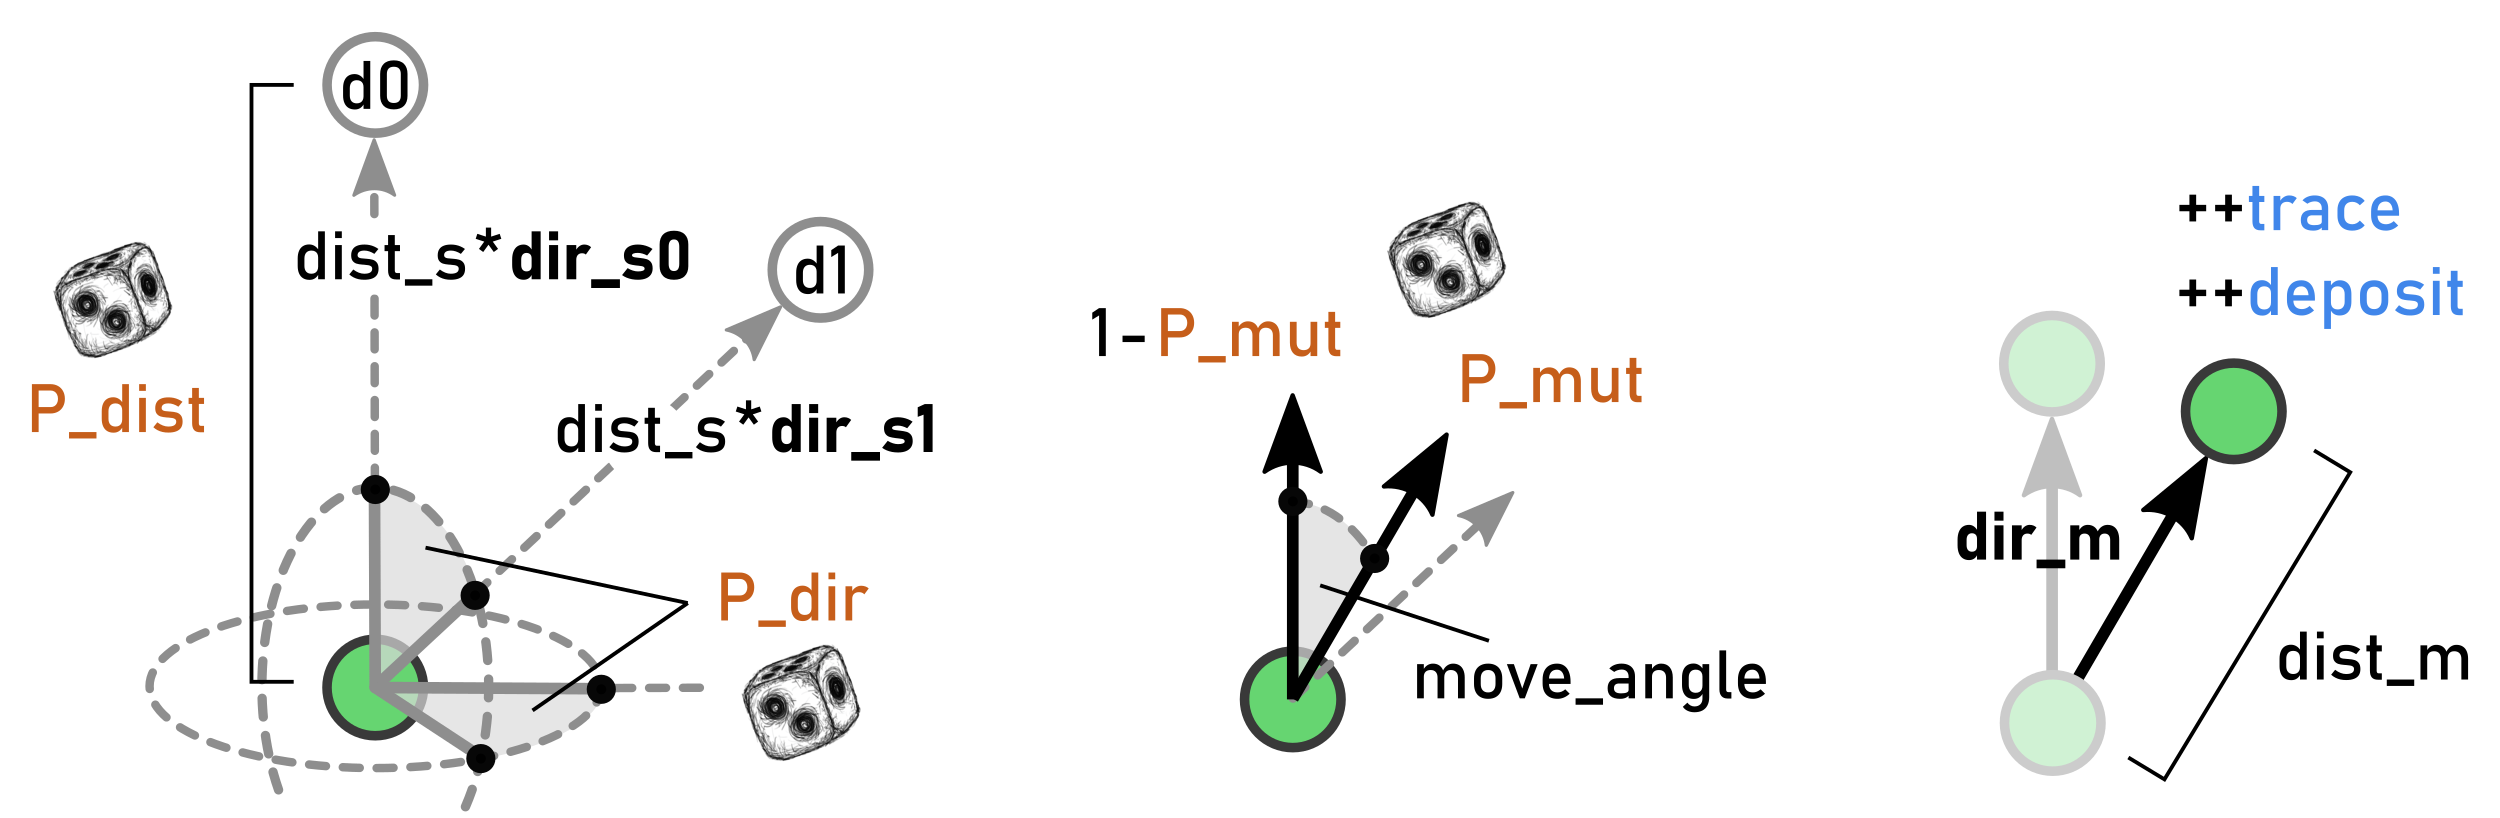
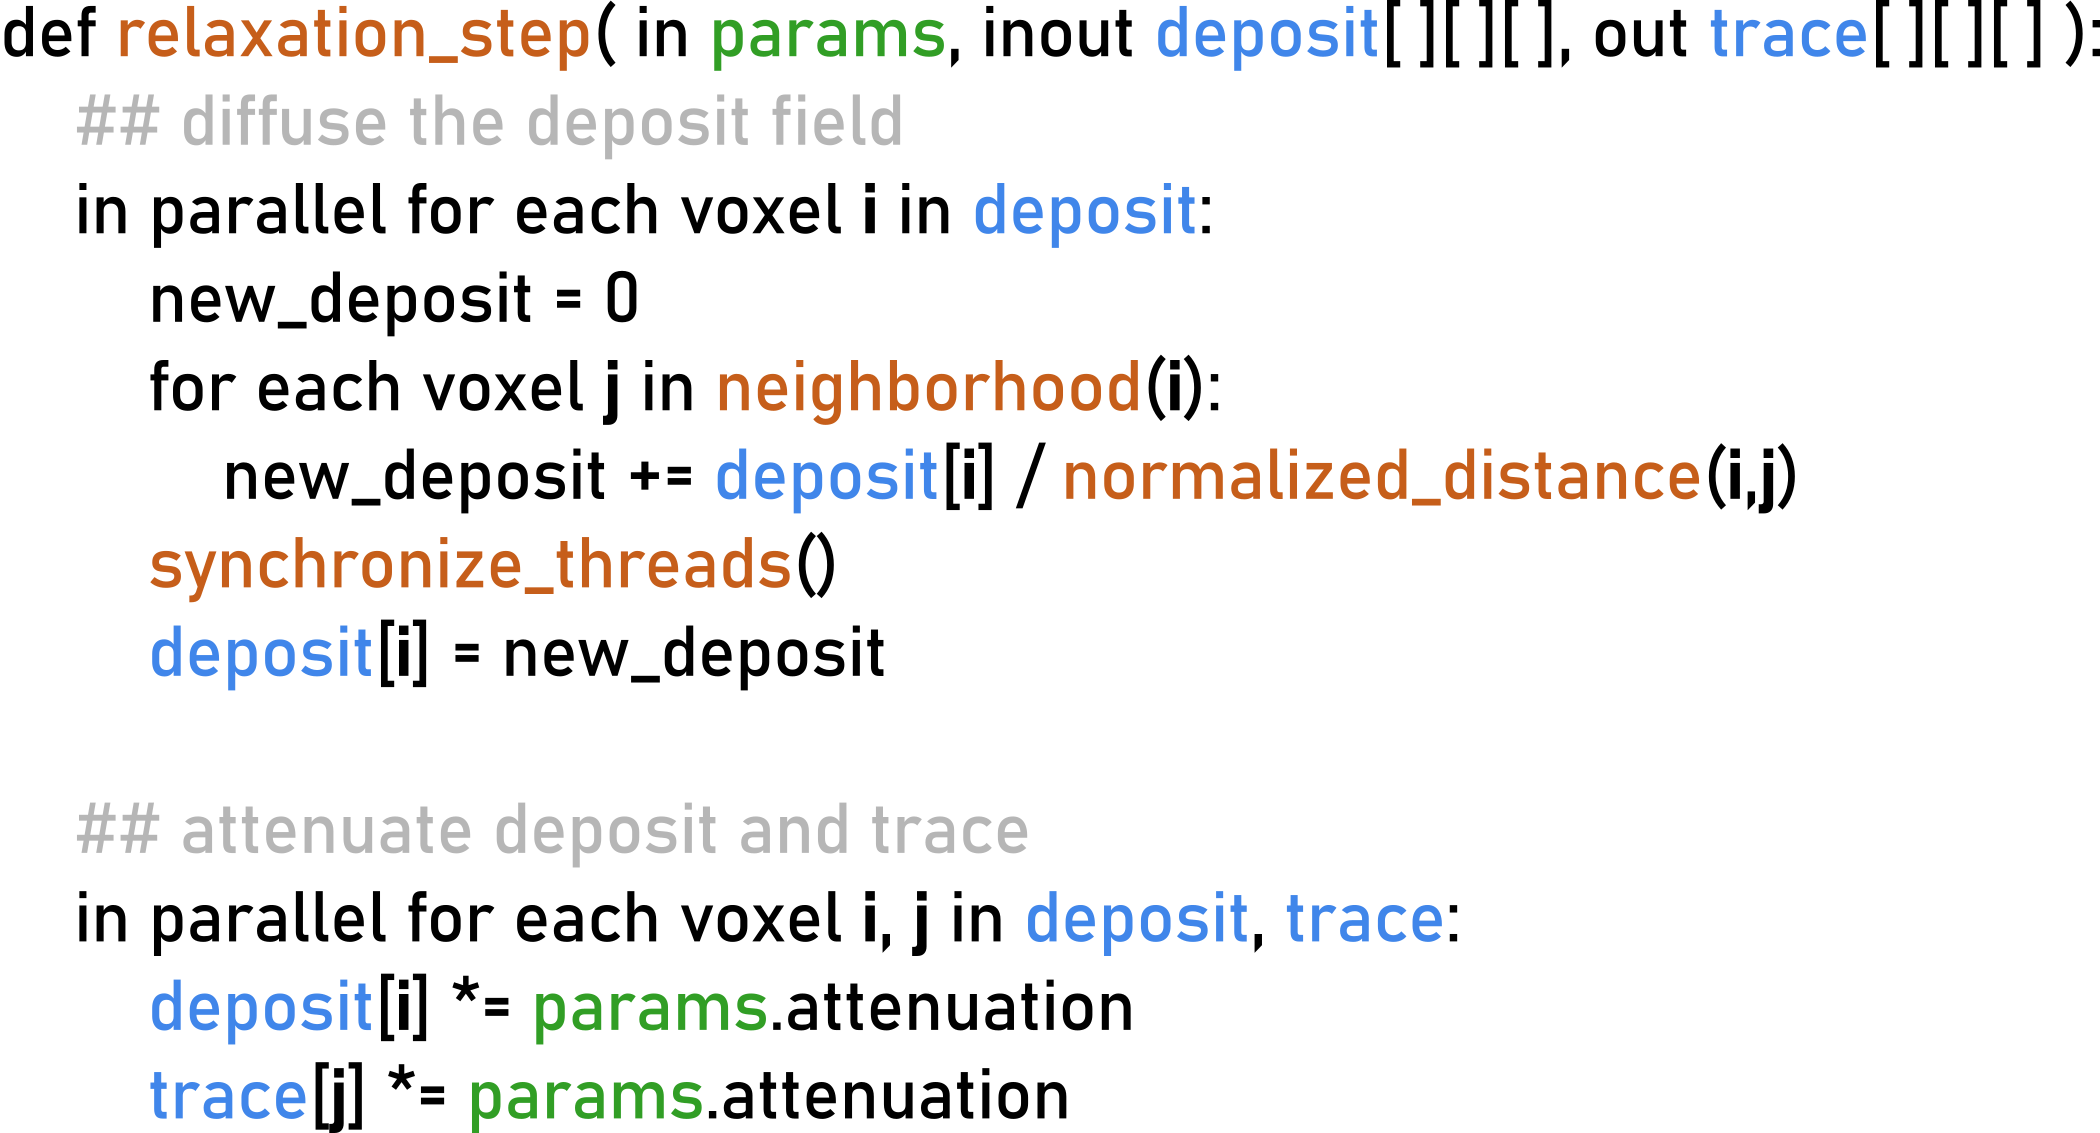
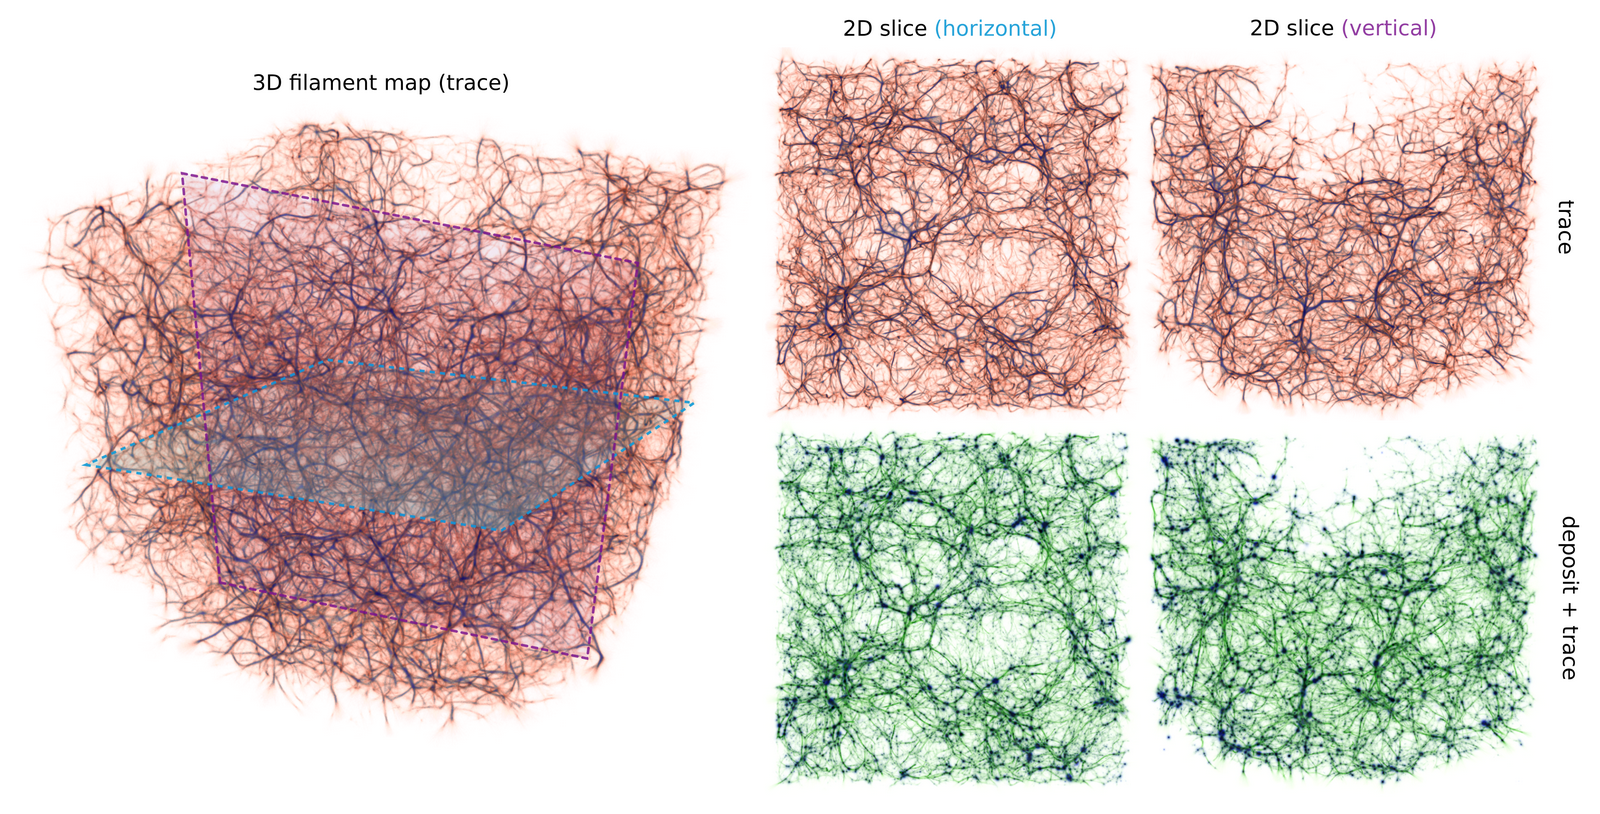
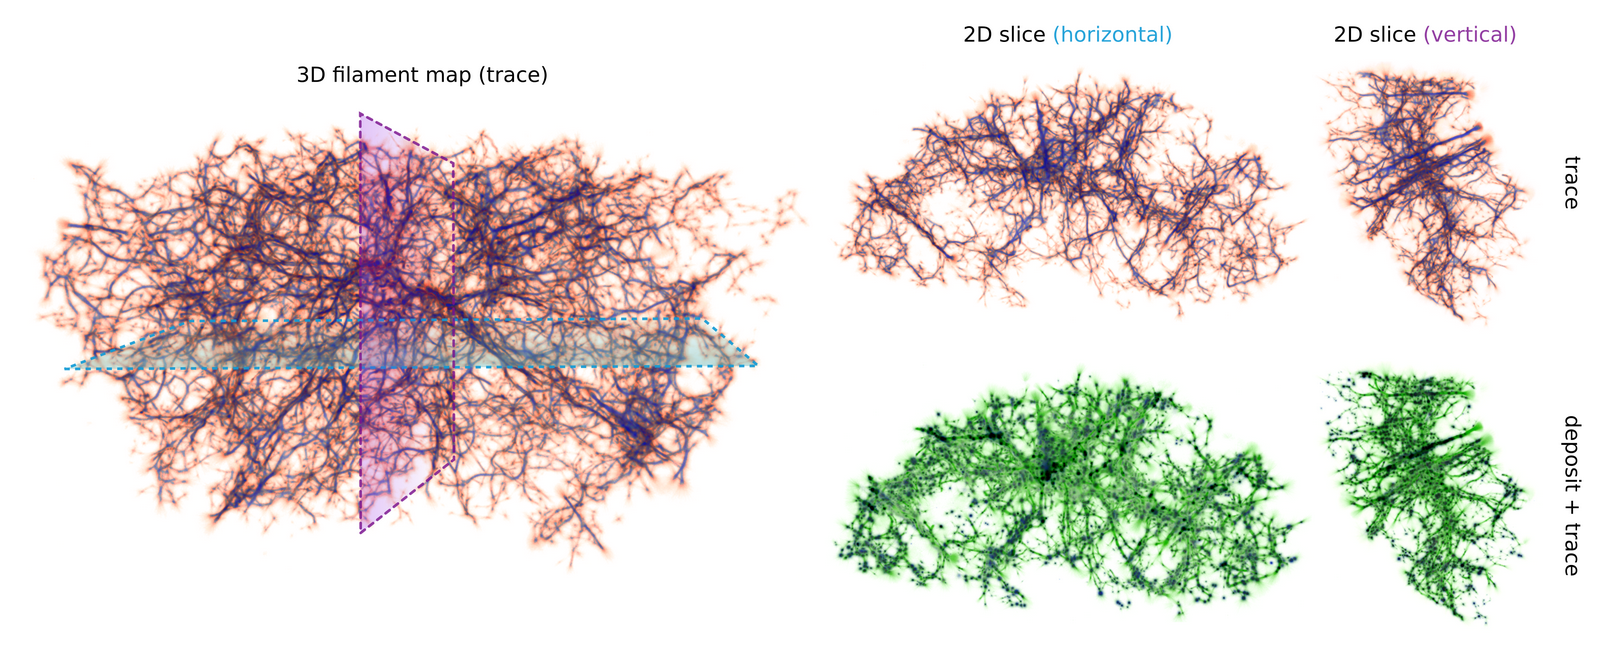
A detailed description of our simulation and visualization methodology is given in our prior works [Elek2021, Elek2022]. In this document, we visually map out the evolution of this project, focusing on three aspects:

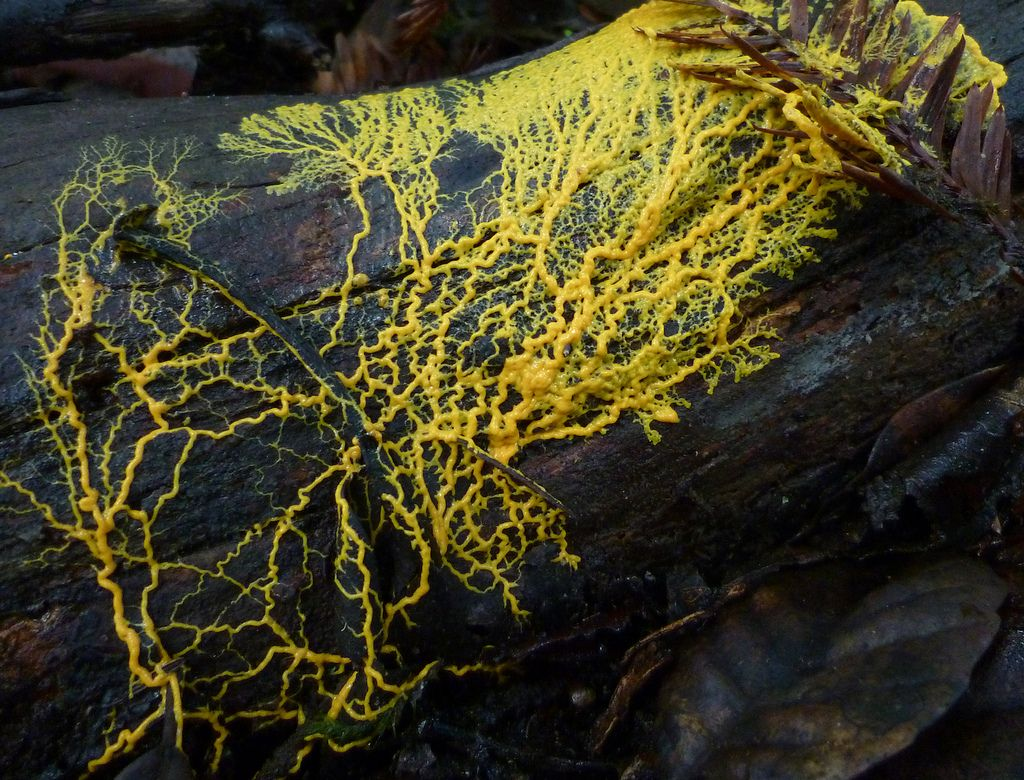
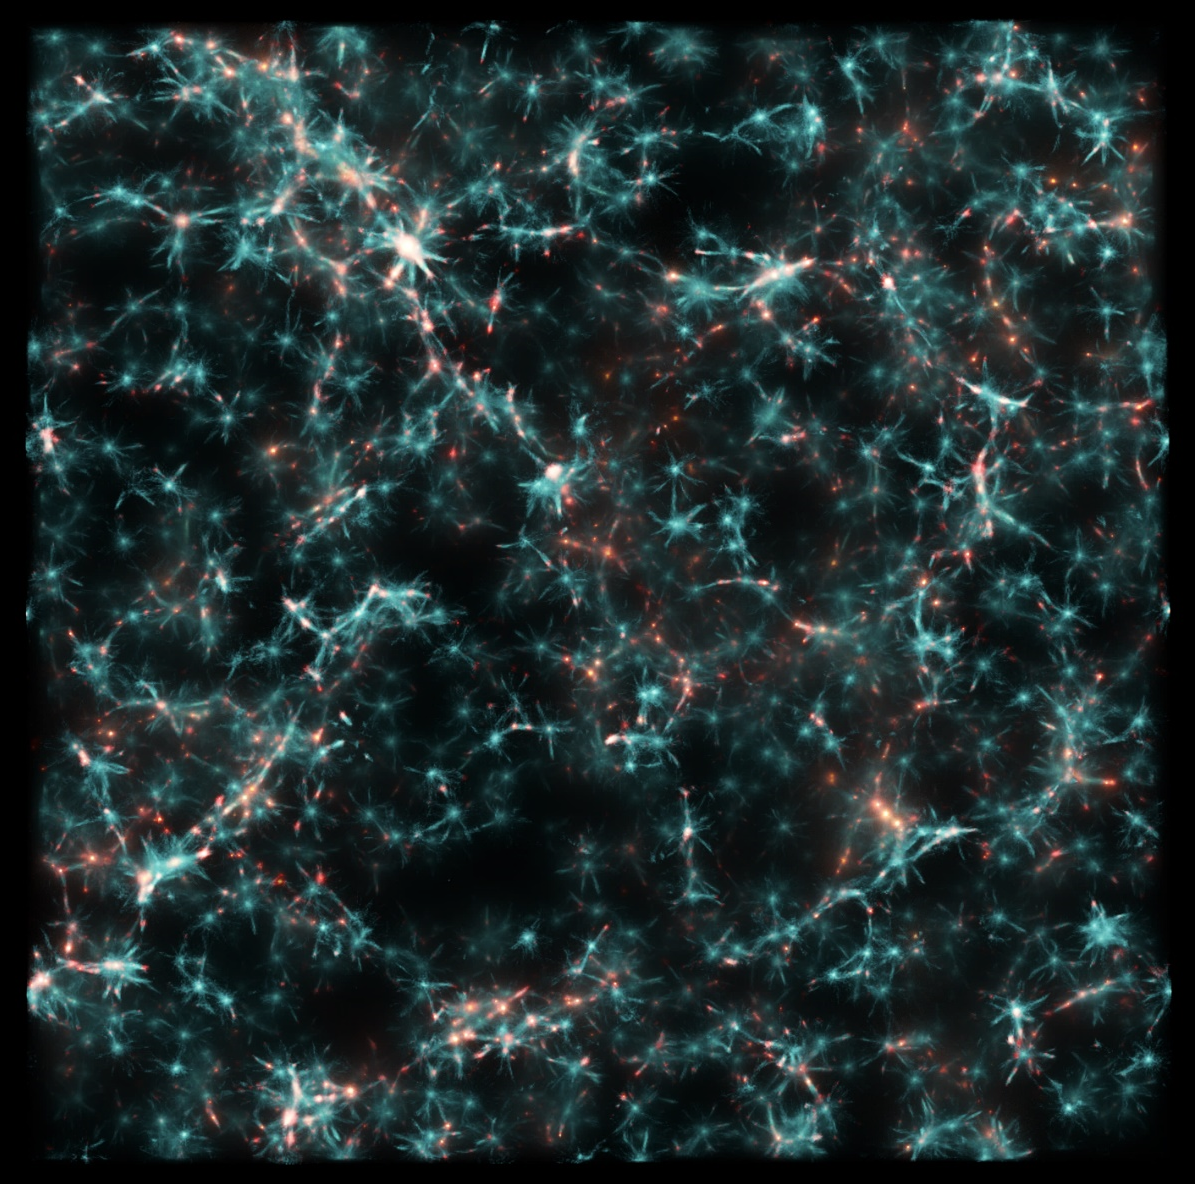
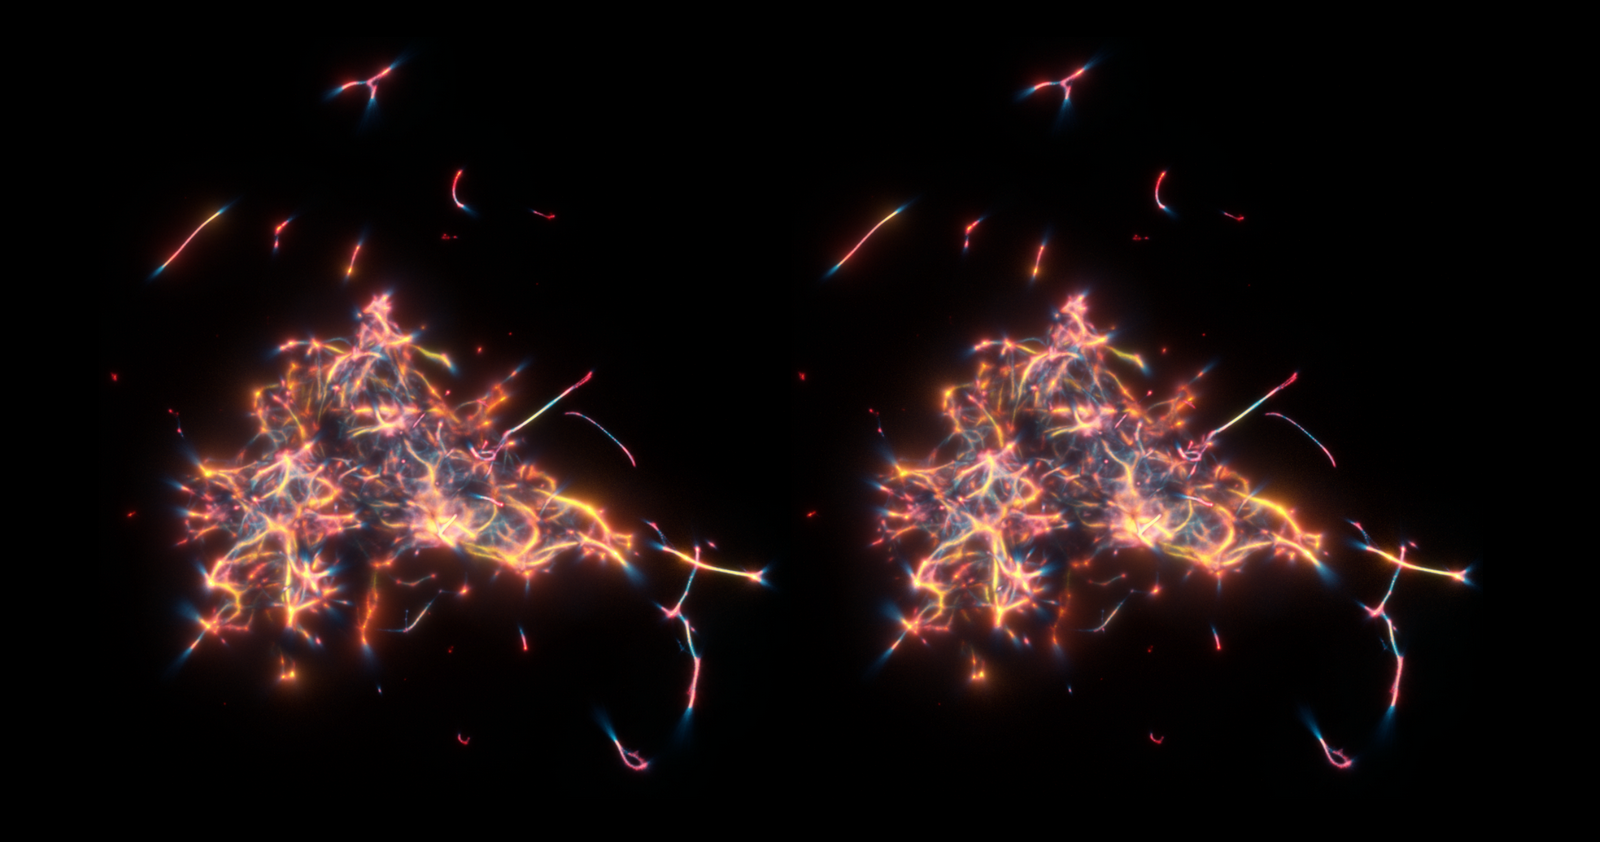
  1. the initial idea of using a simulated Physarum machine for generating a scalar density field representing the 3D matter distribution of the Cosmic web,
  2. algorithmic design choices in our methodology, and
  3. its concrete applications in both simulated and observational cosmological datasets.
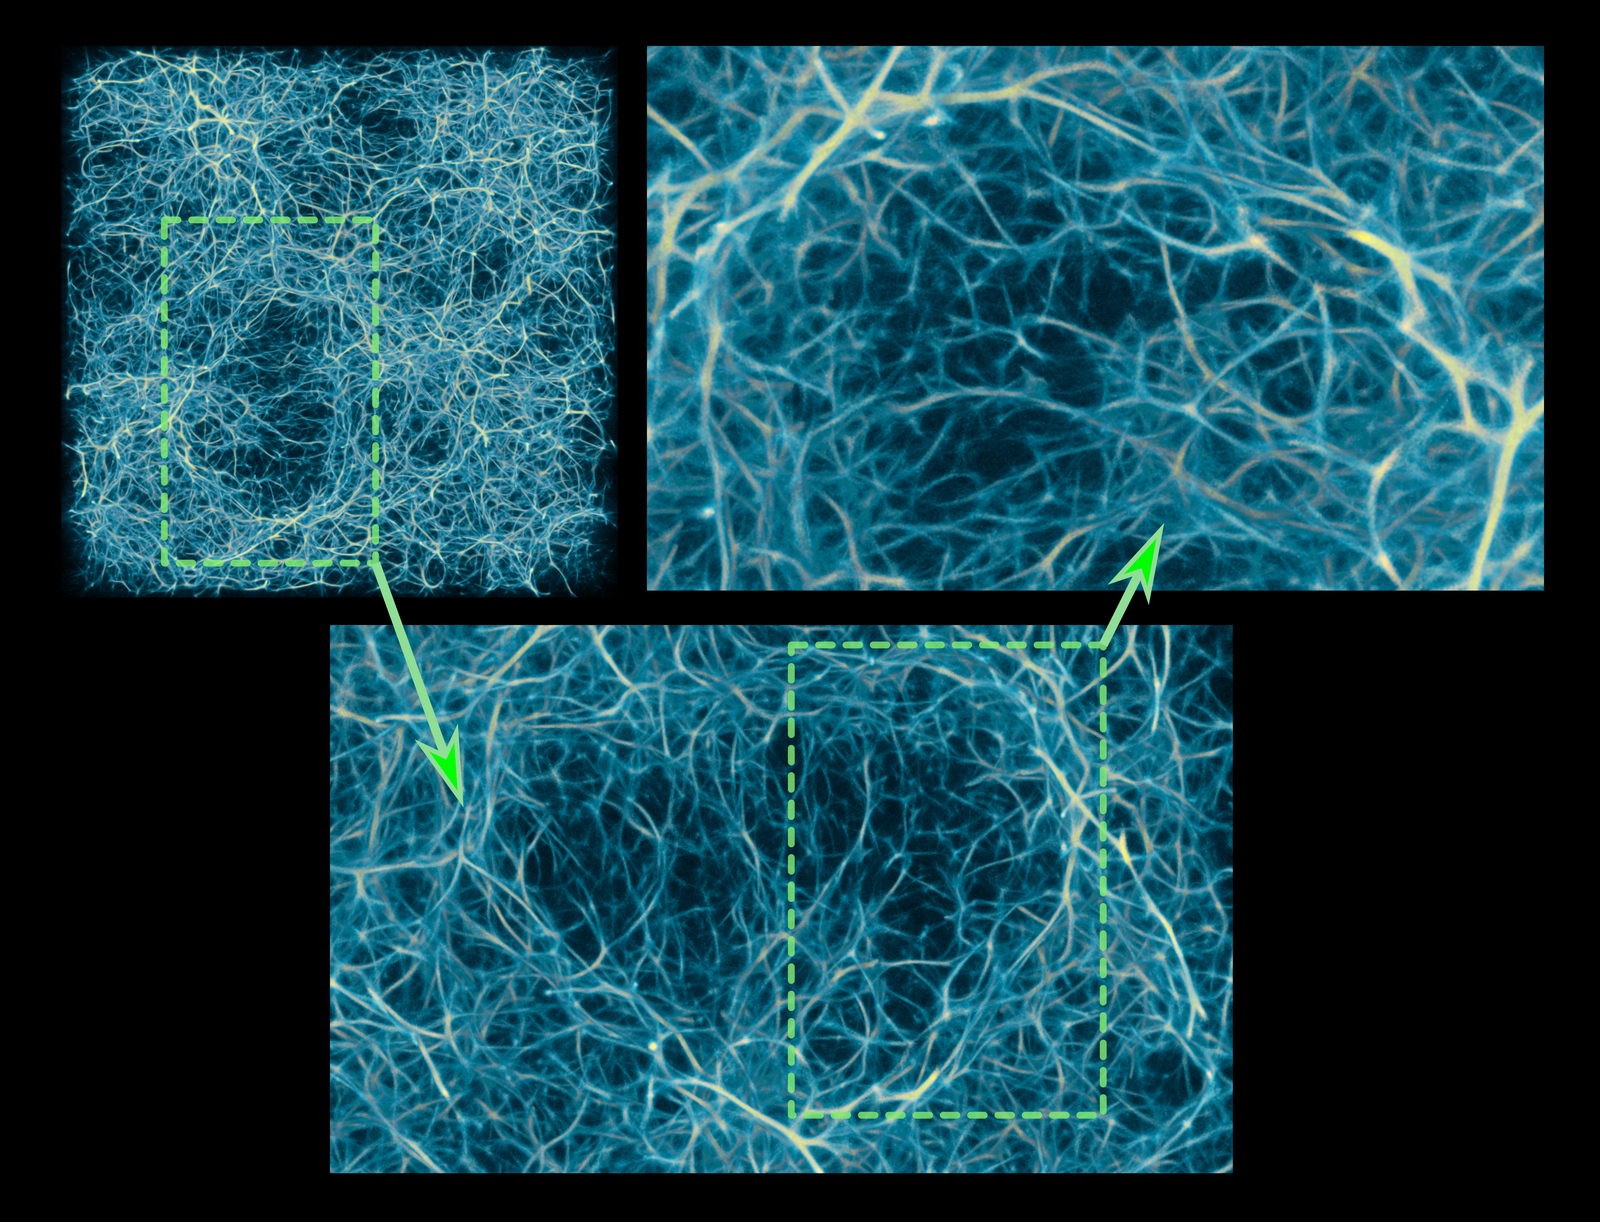
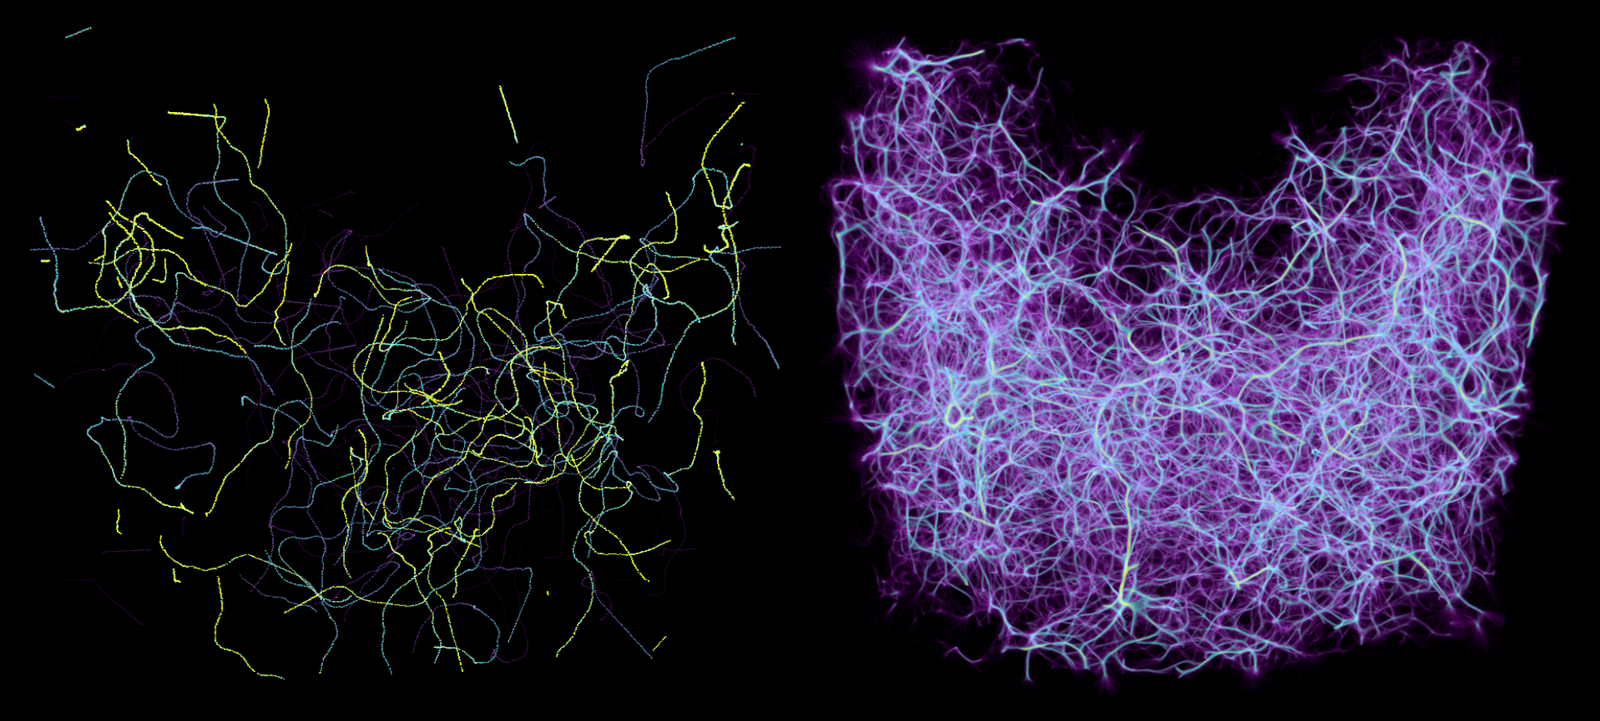
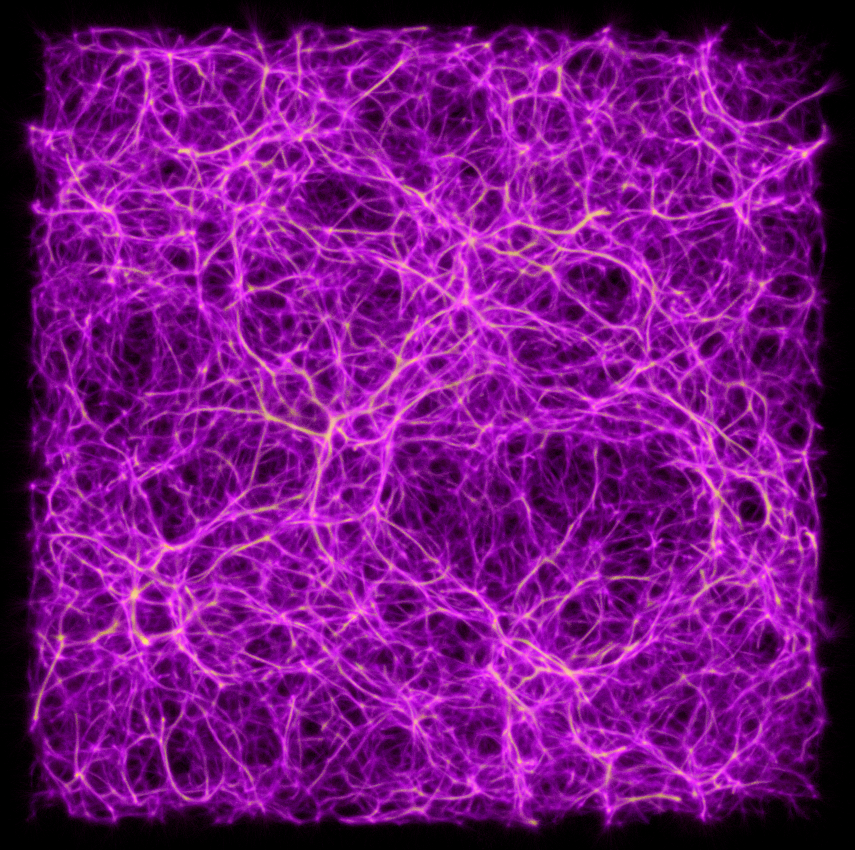
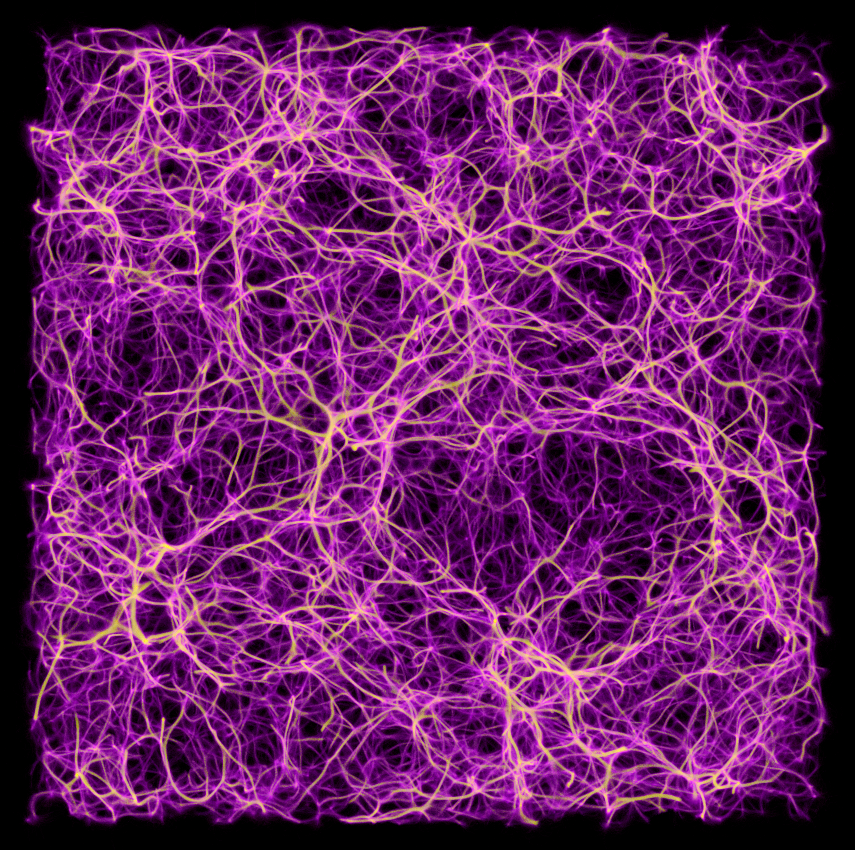
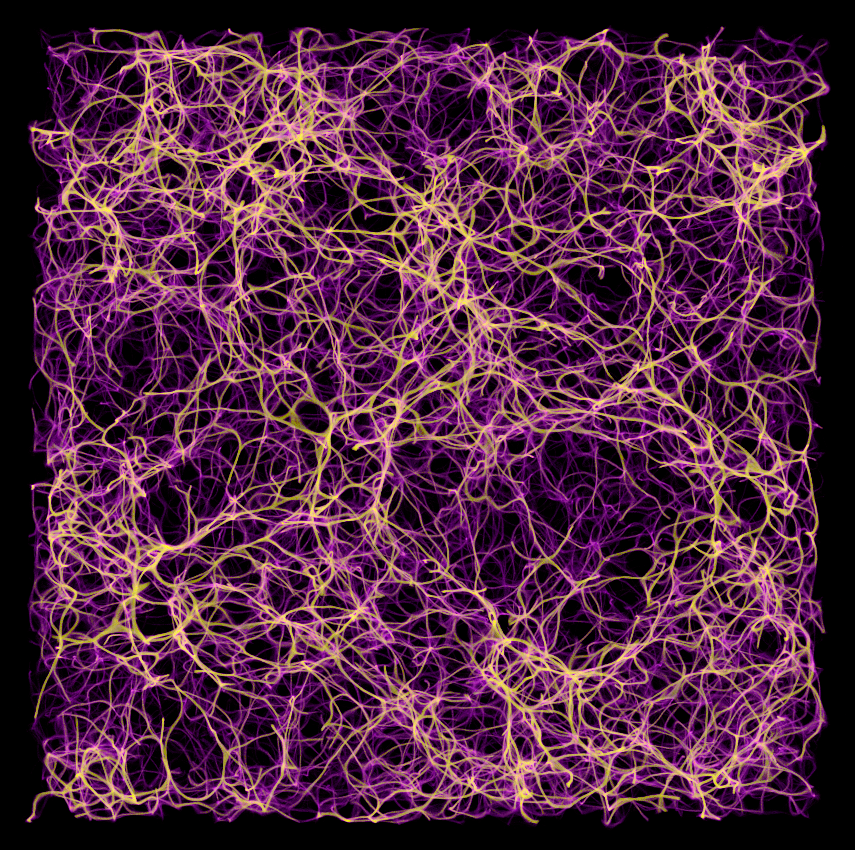
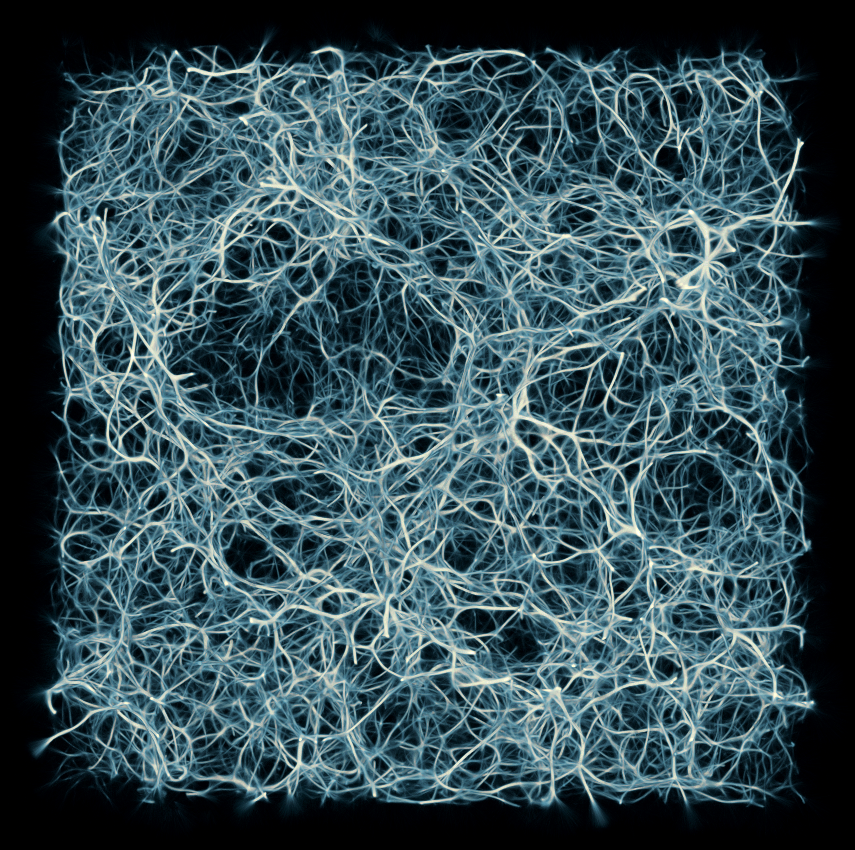
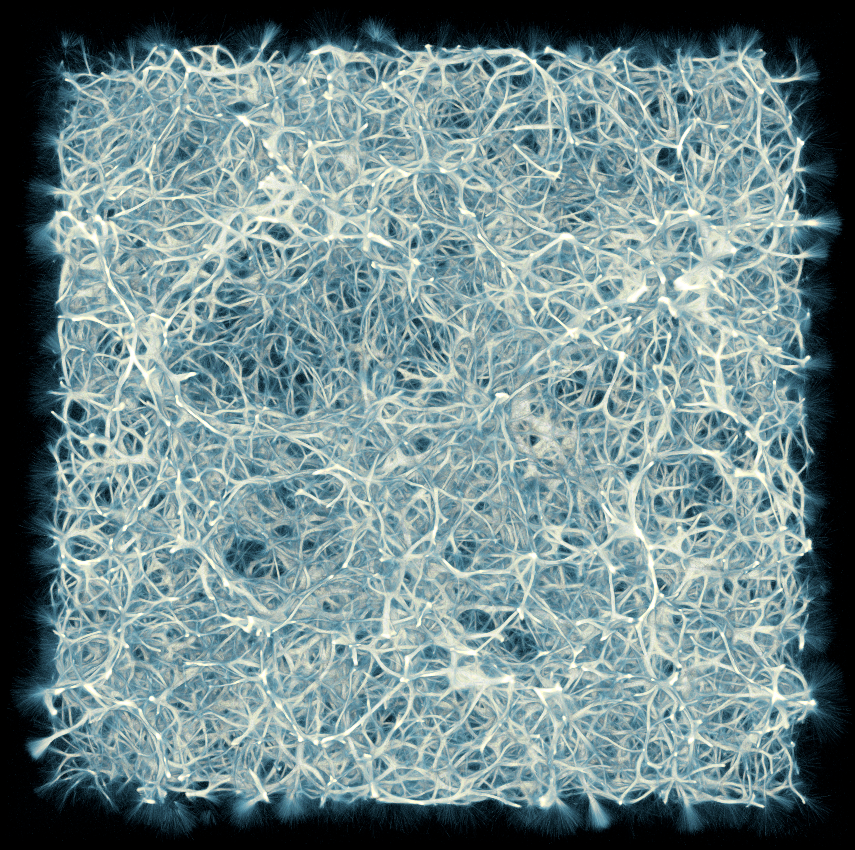
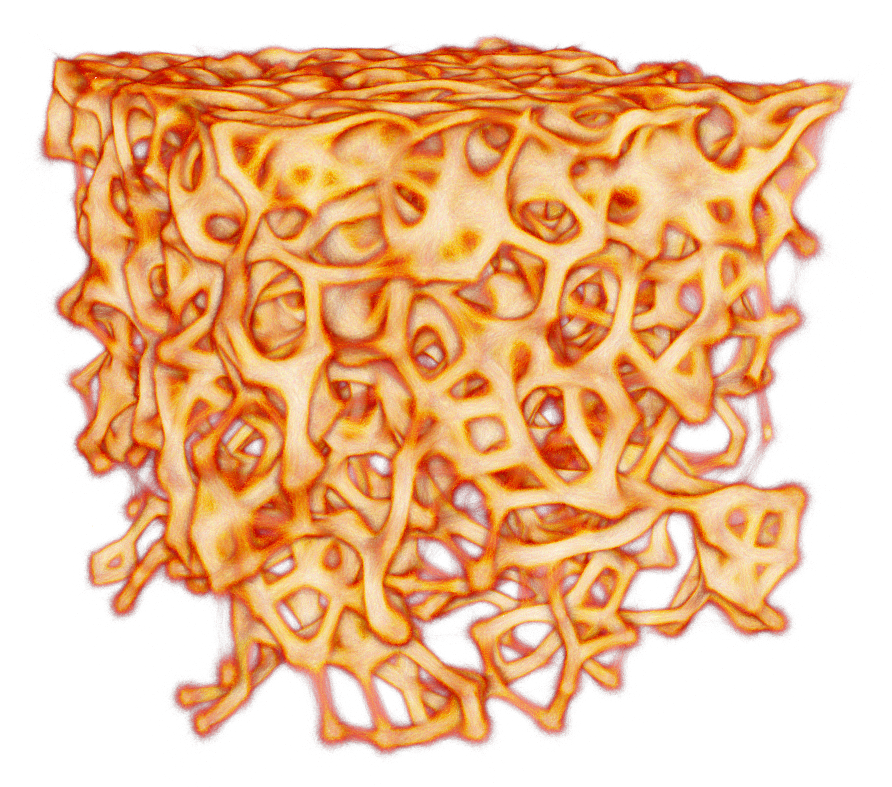
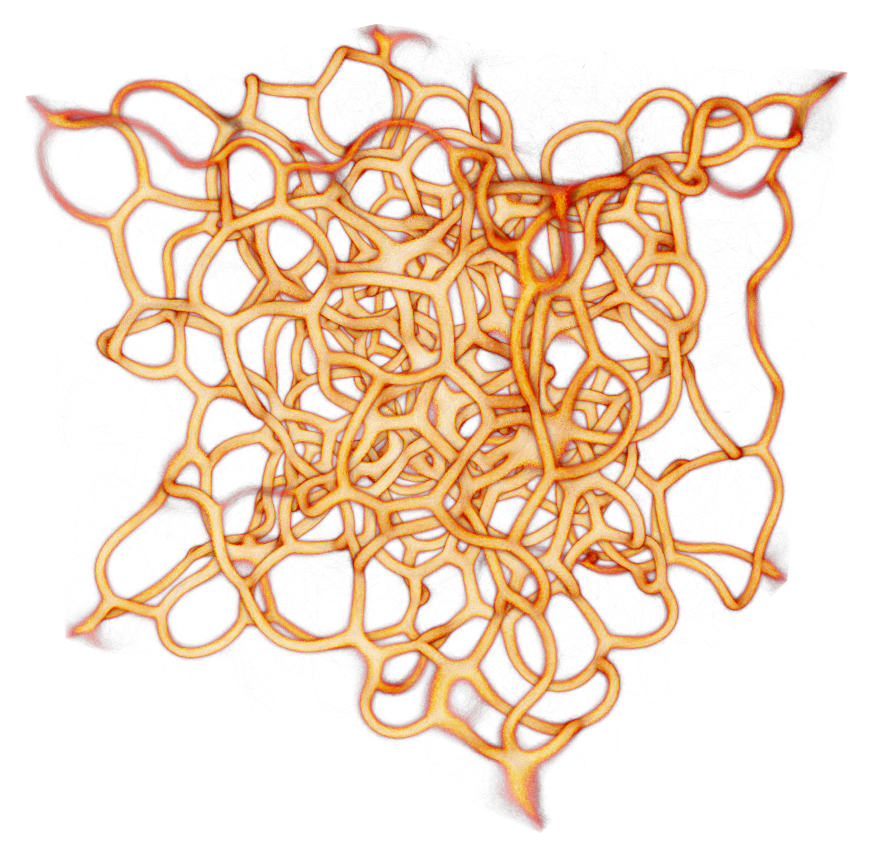
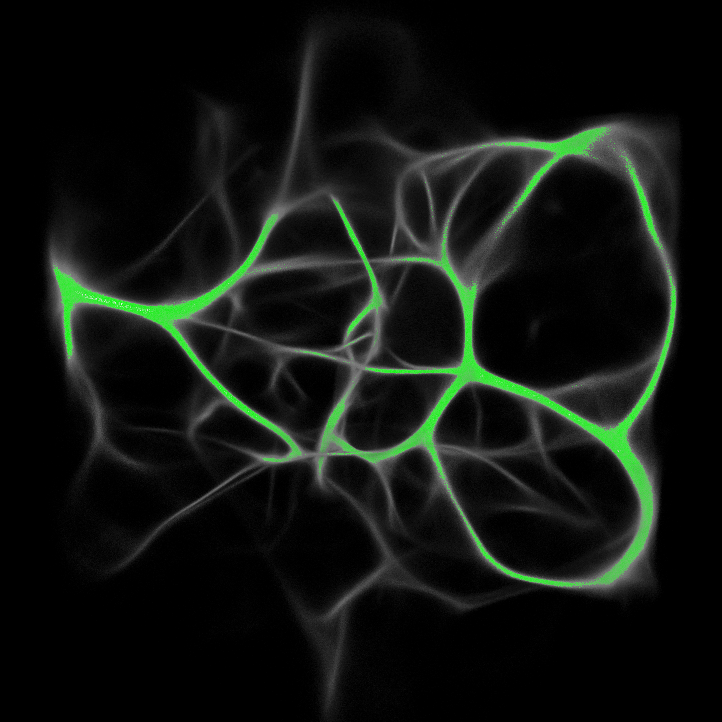
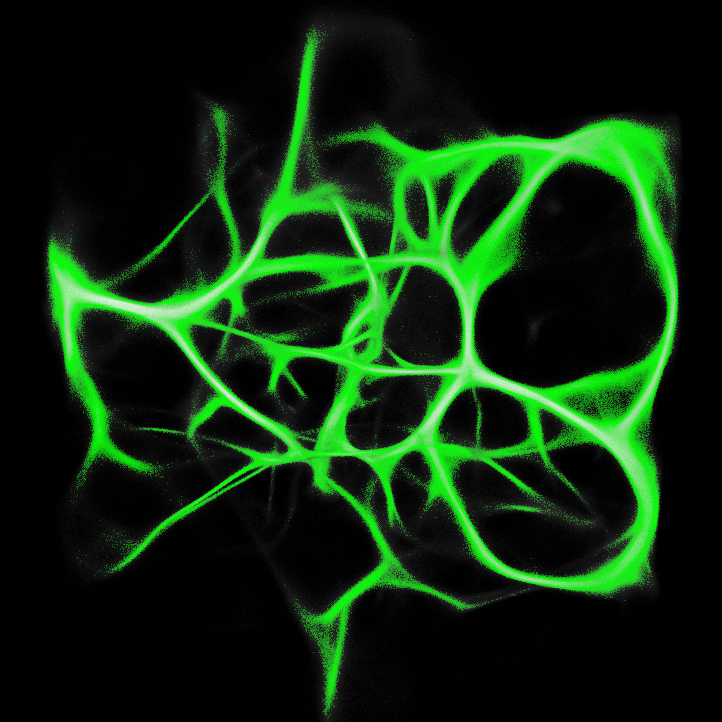
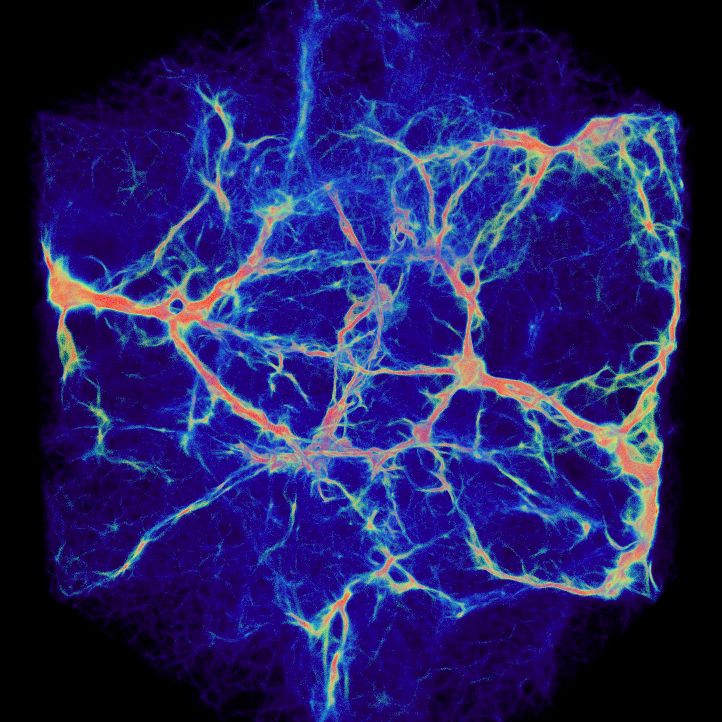
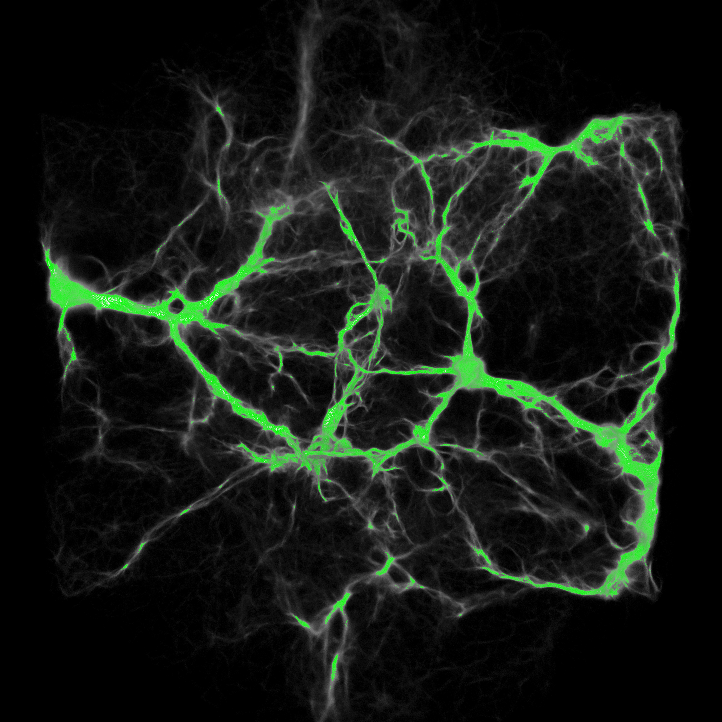
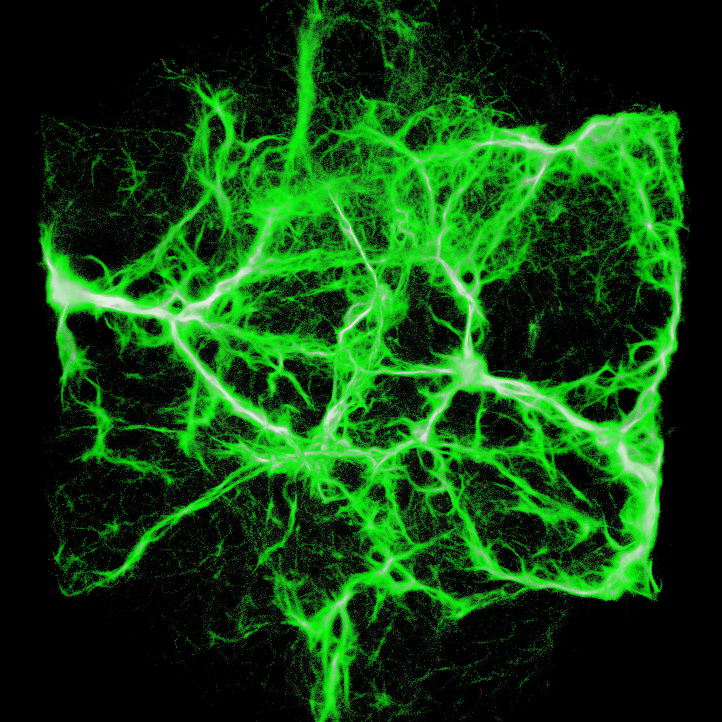
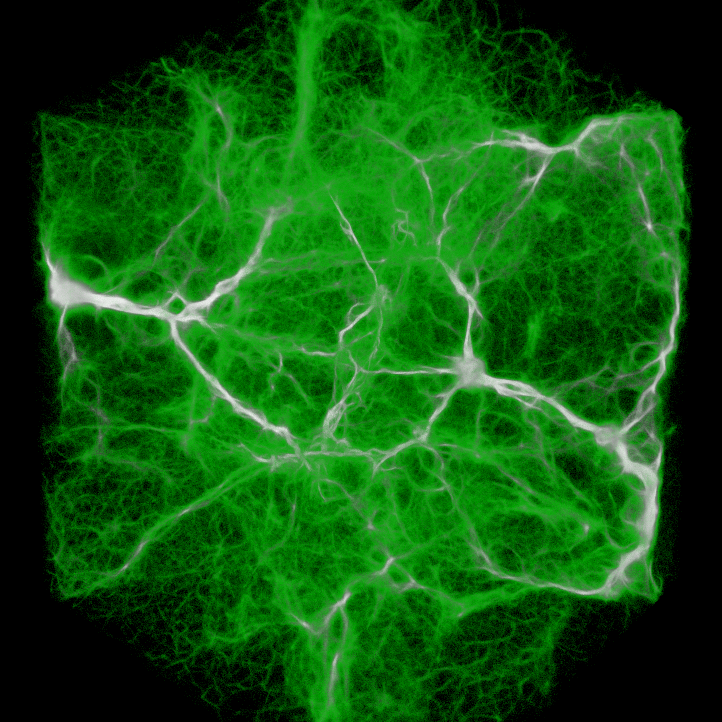
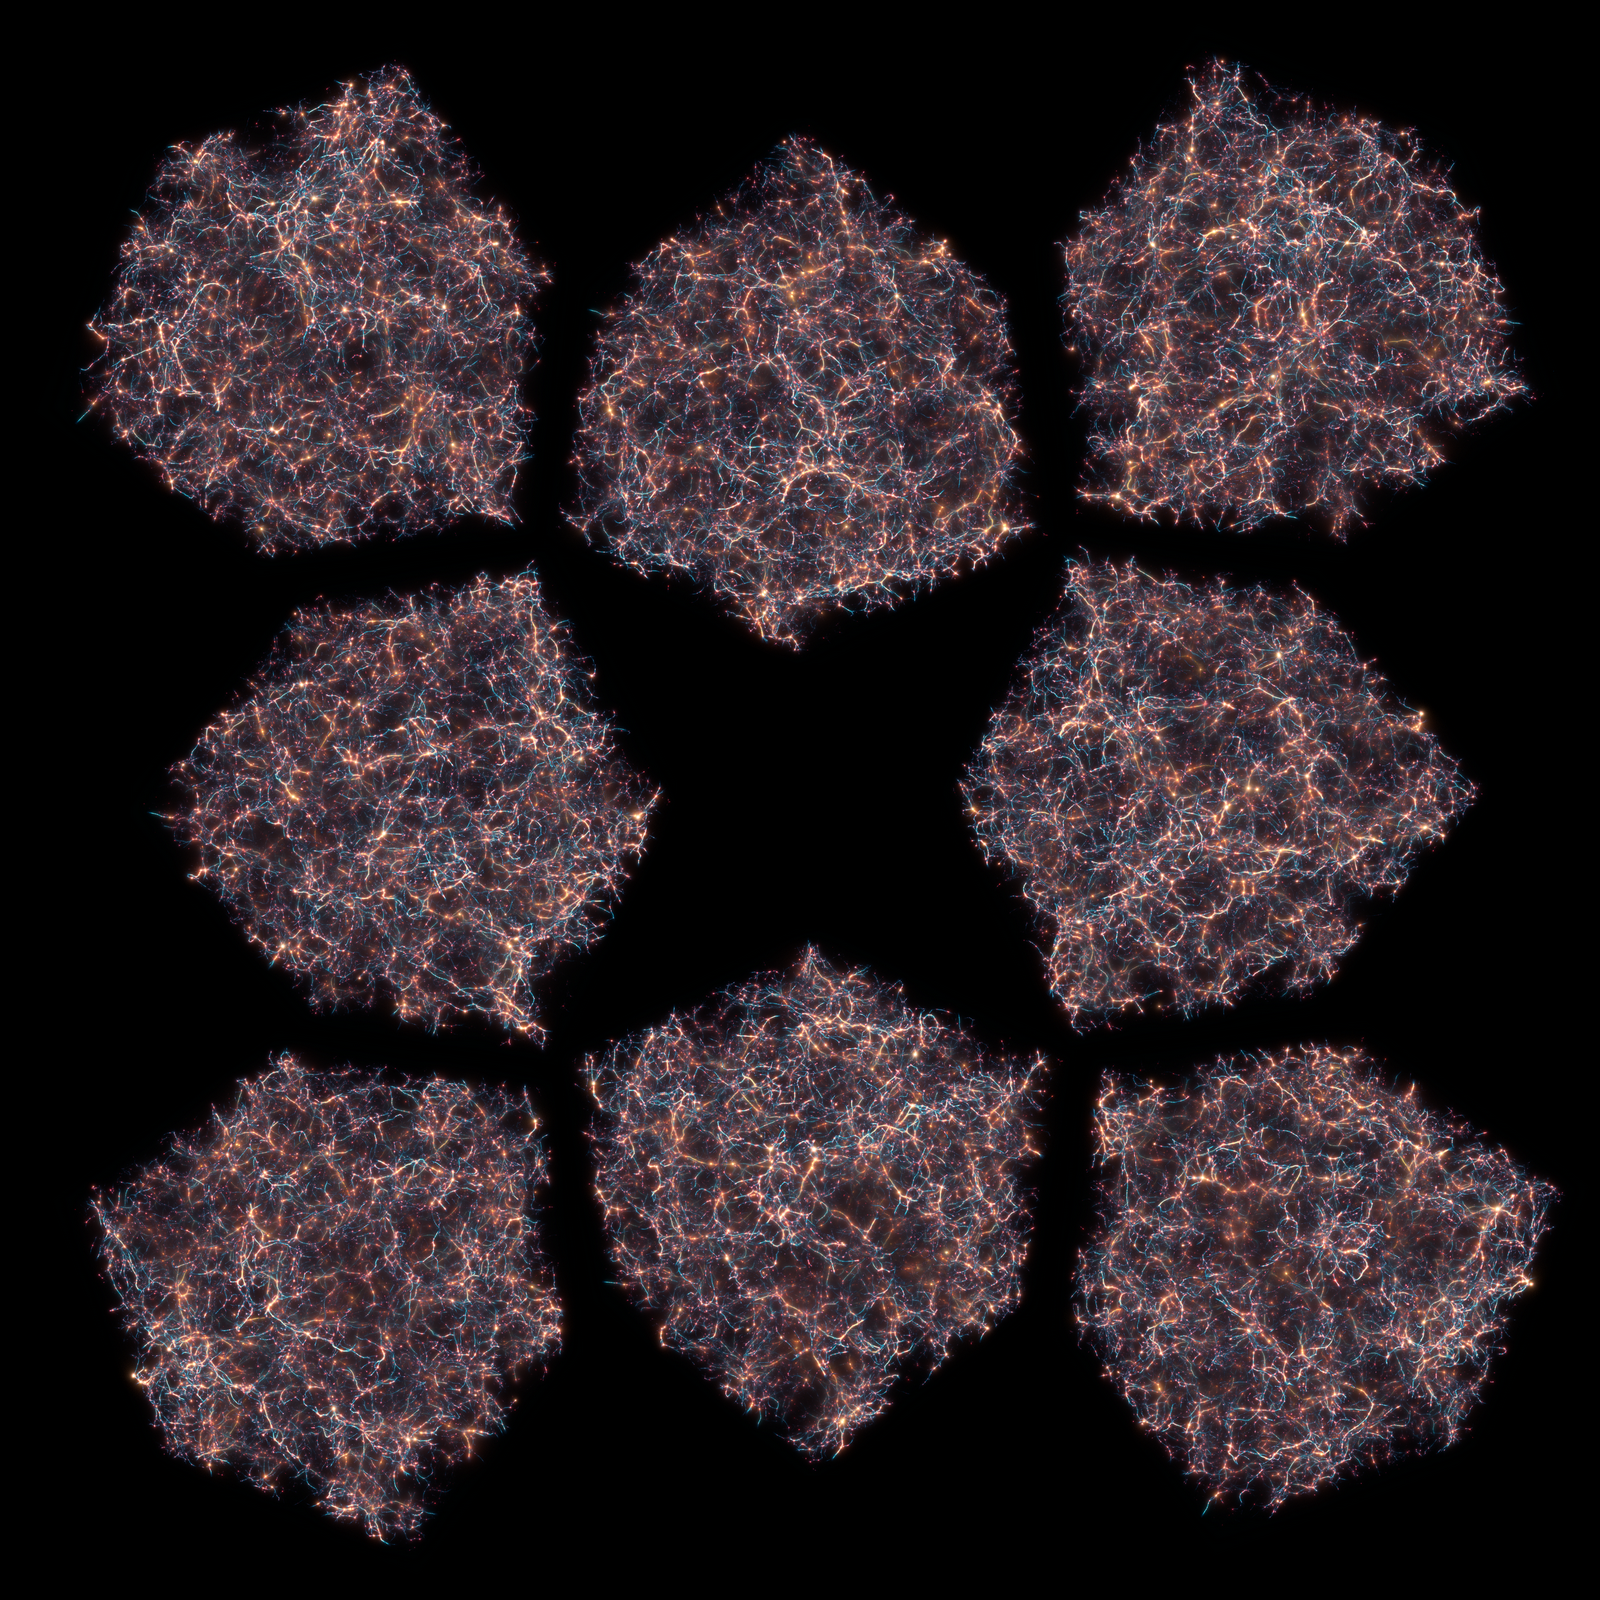
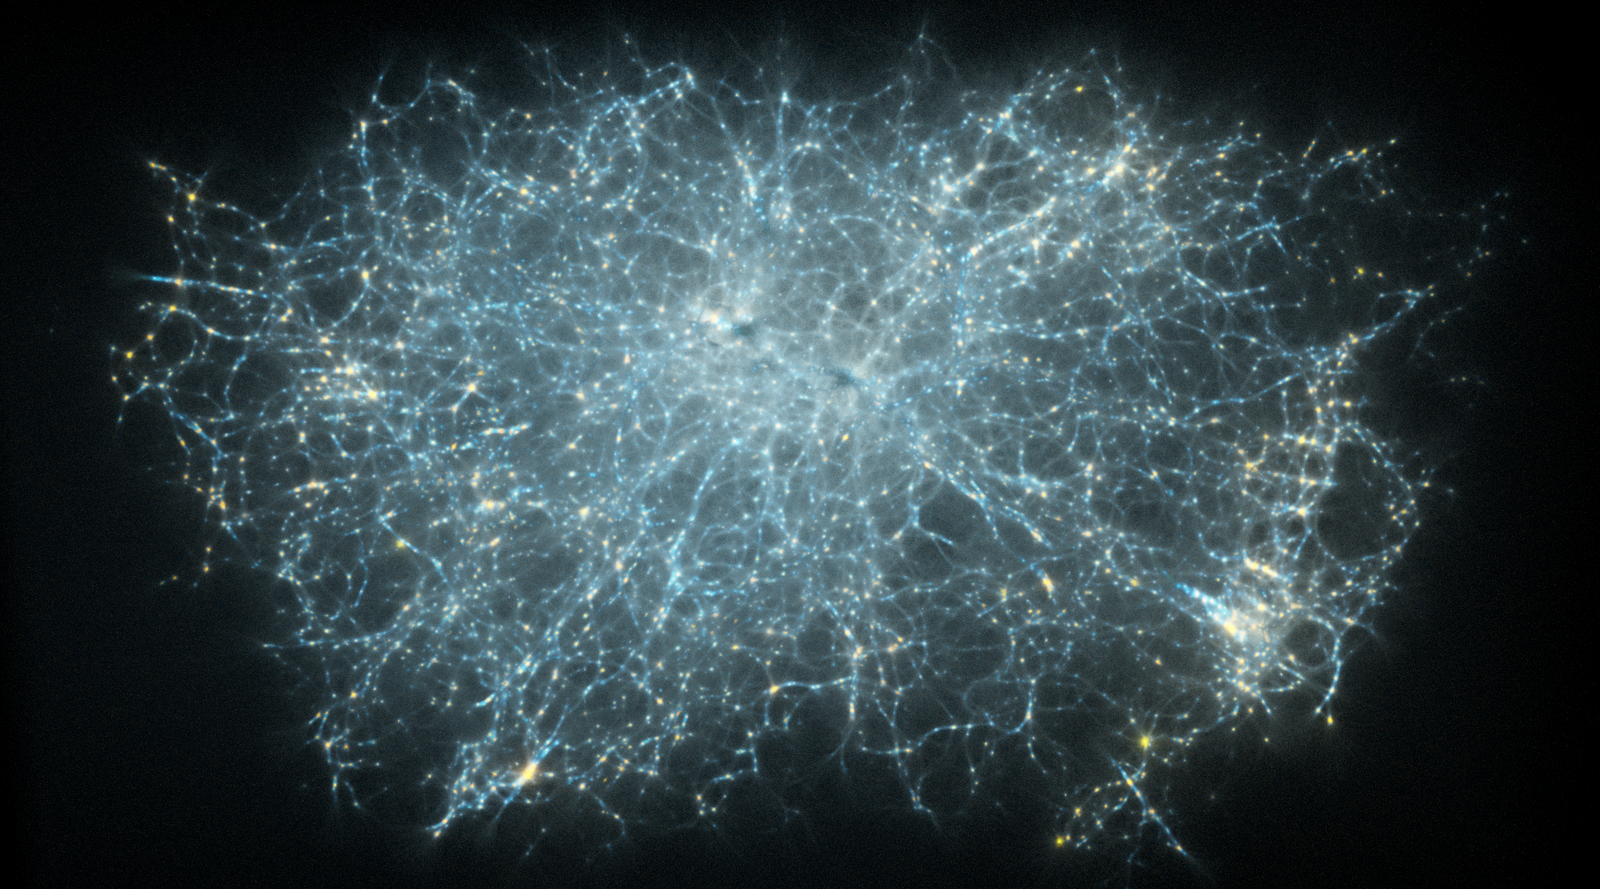
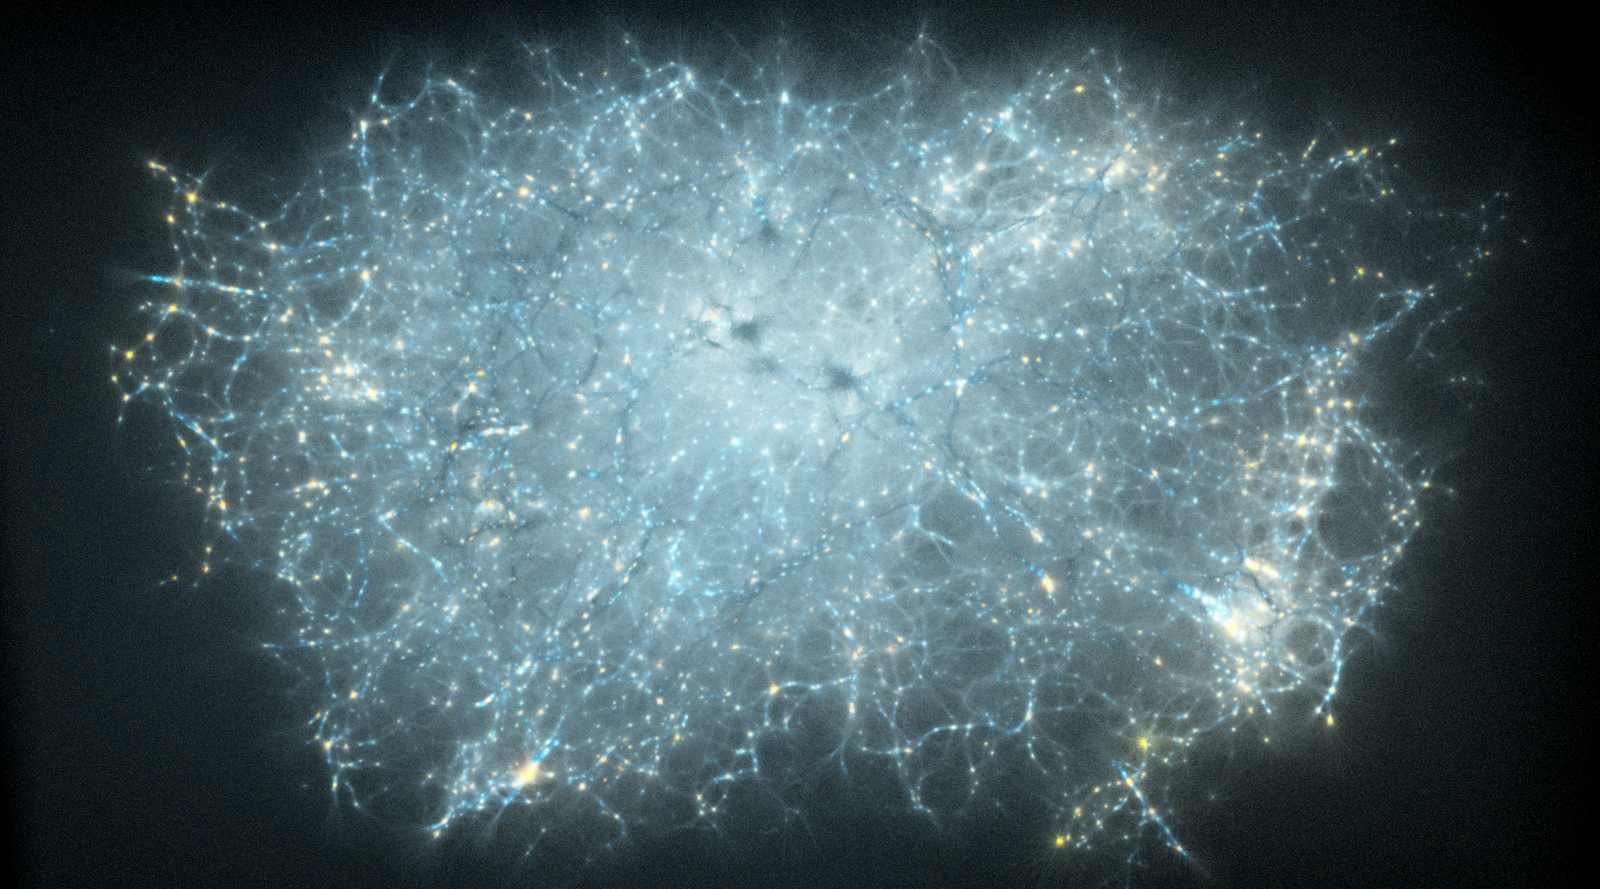
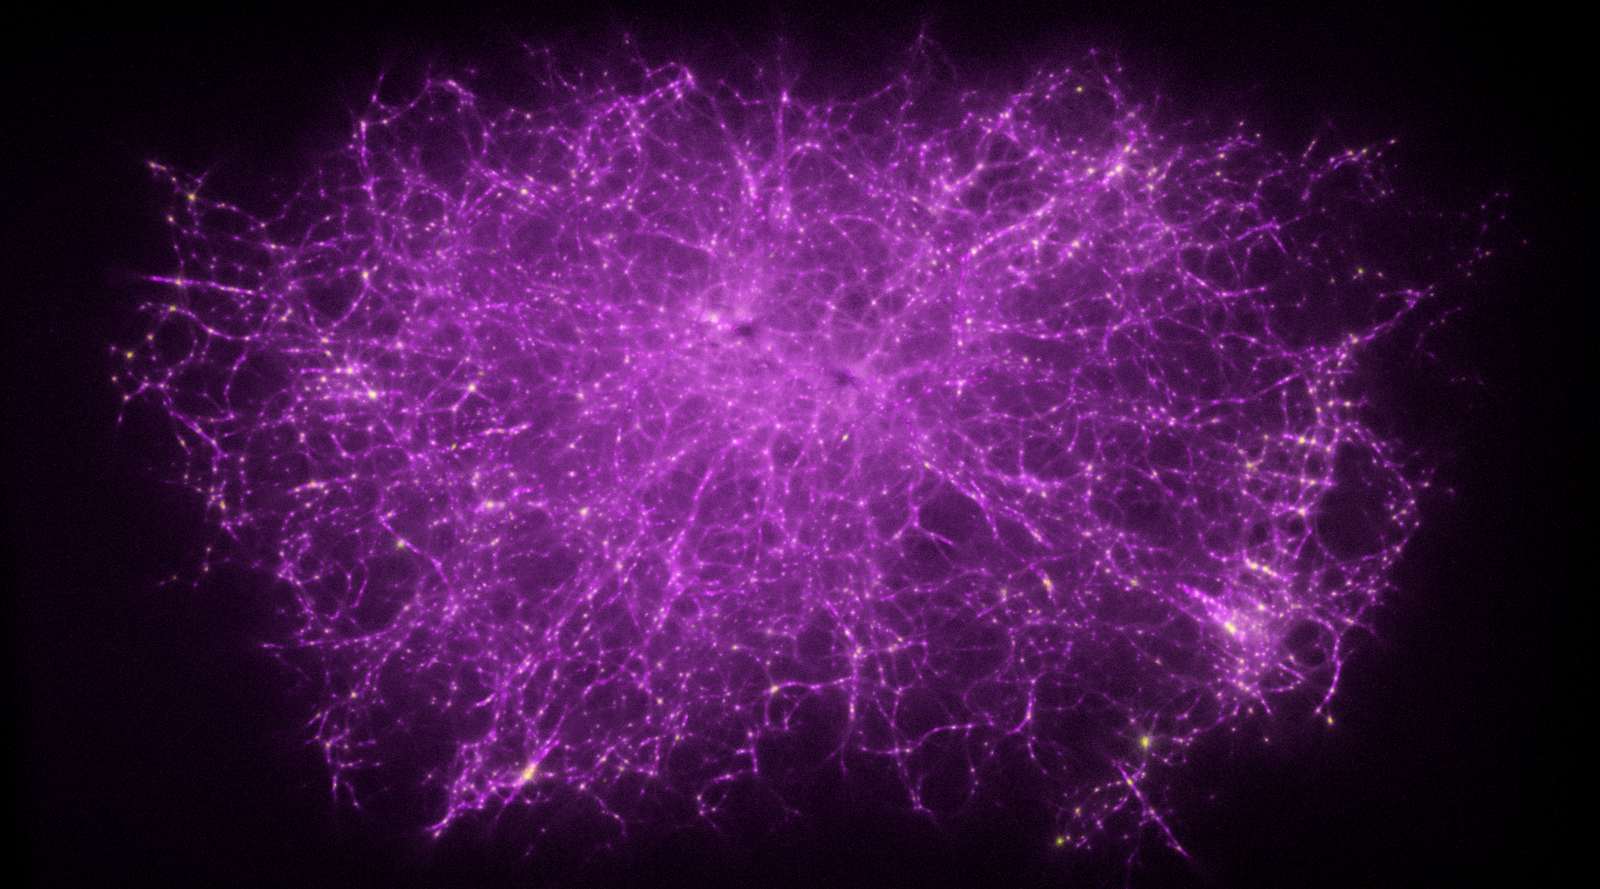
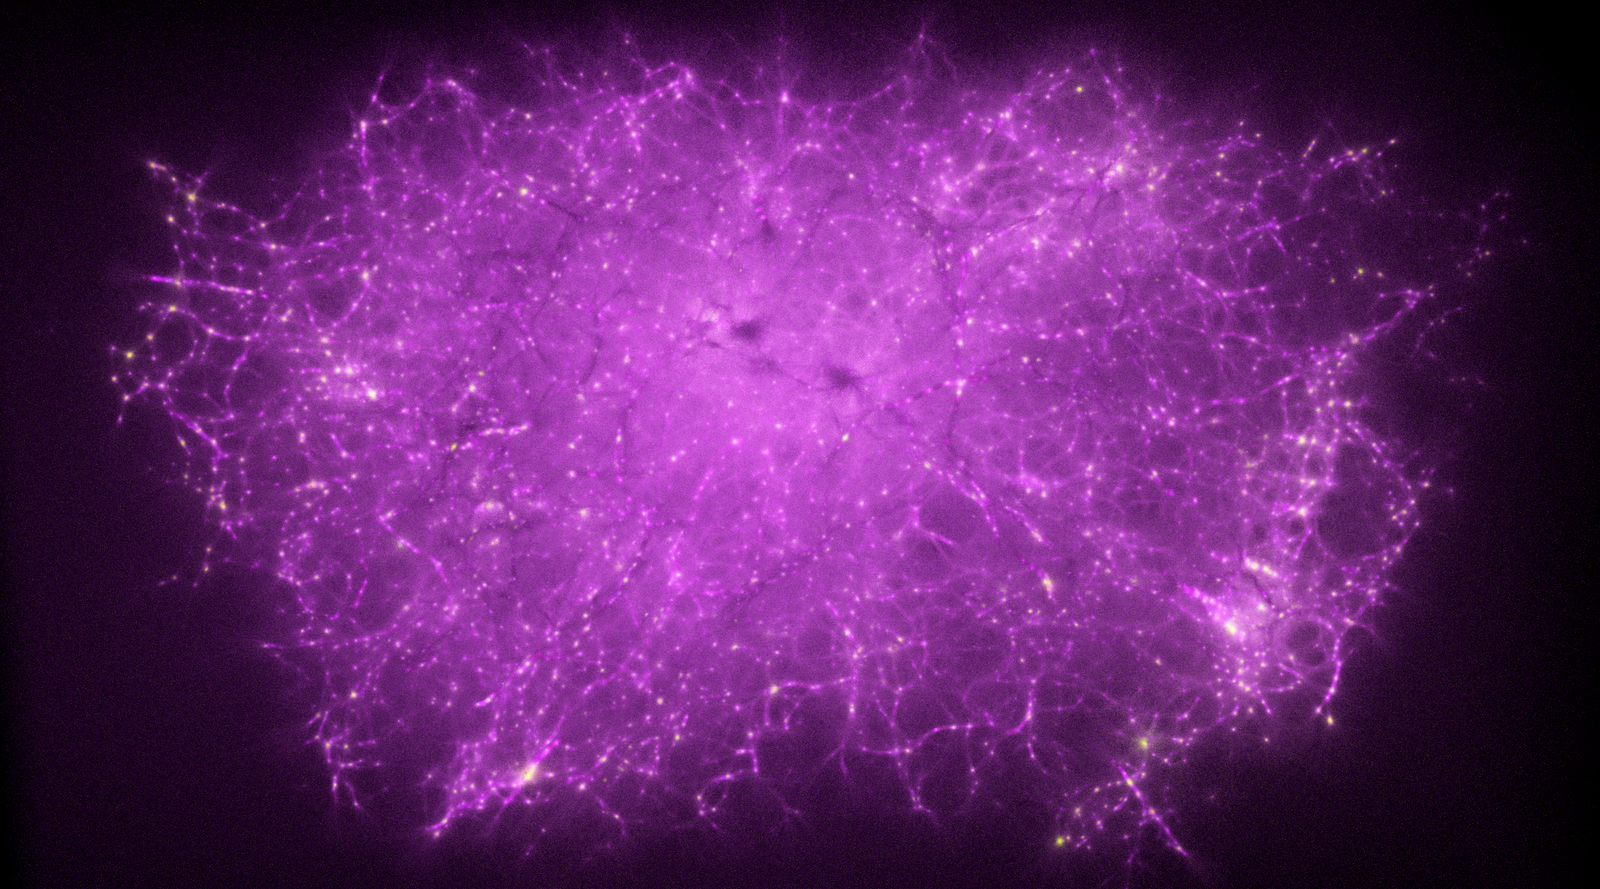
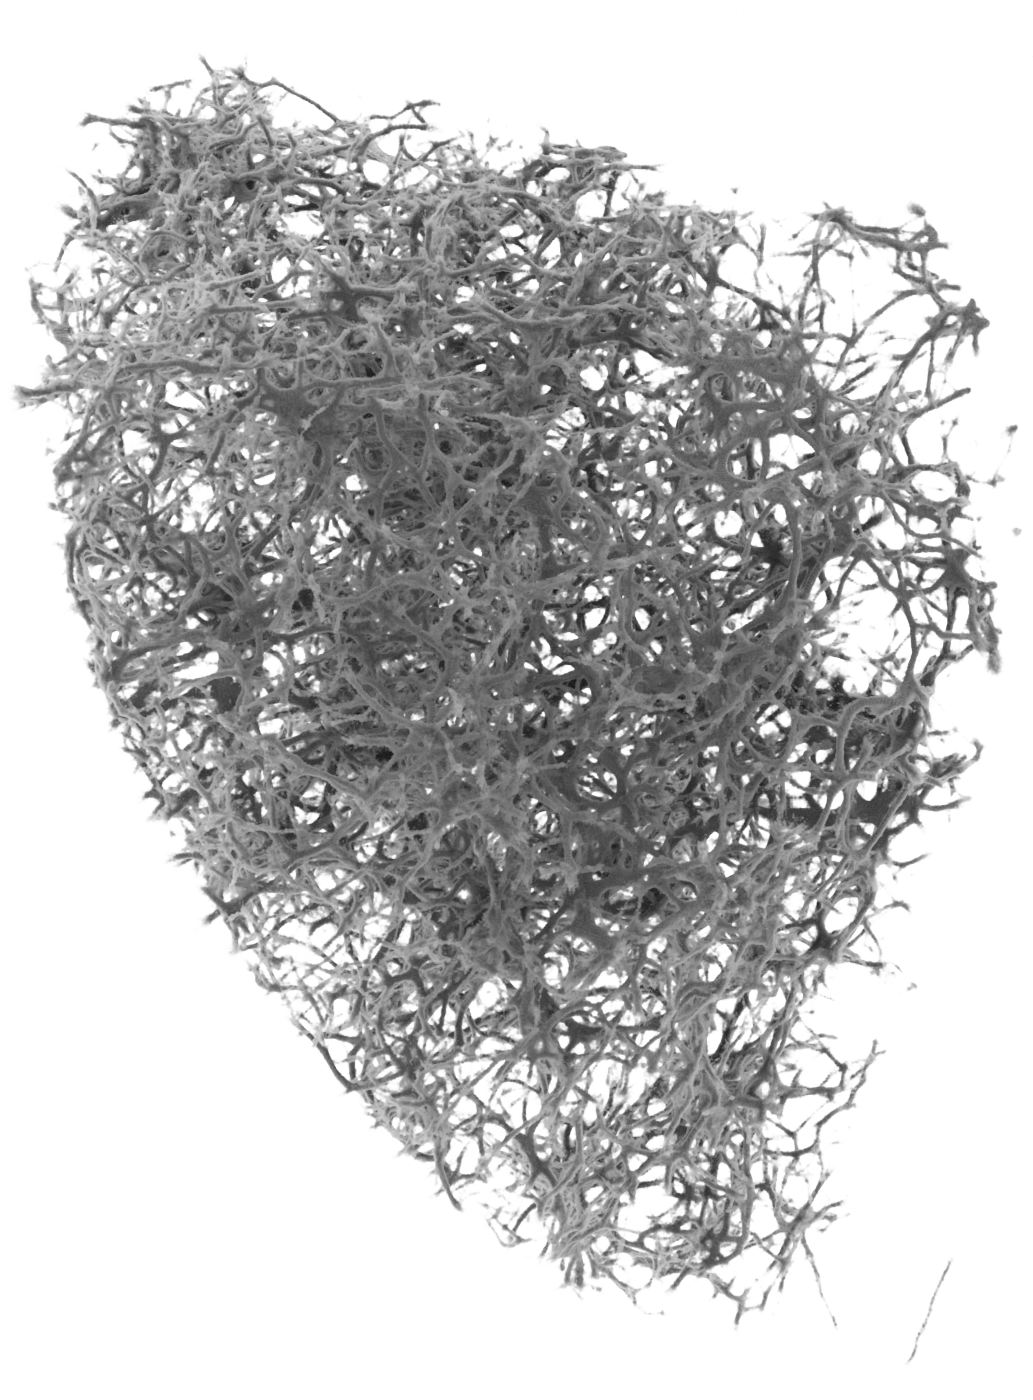
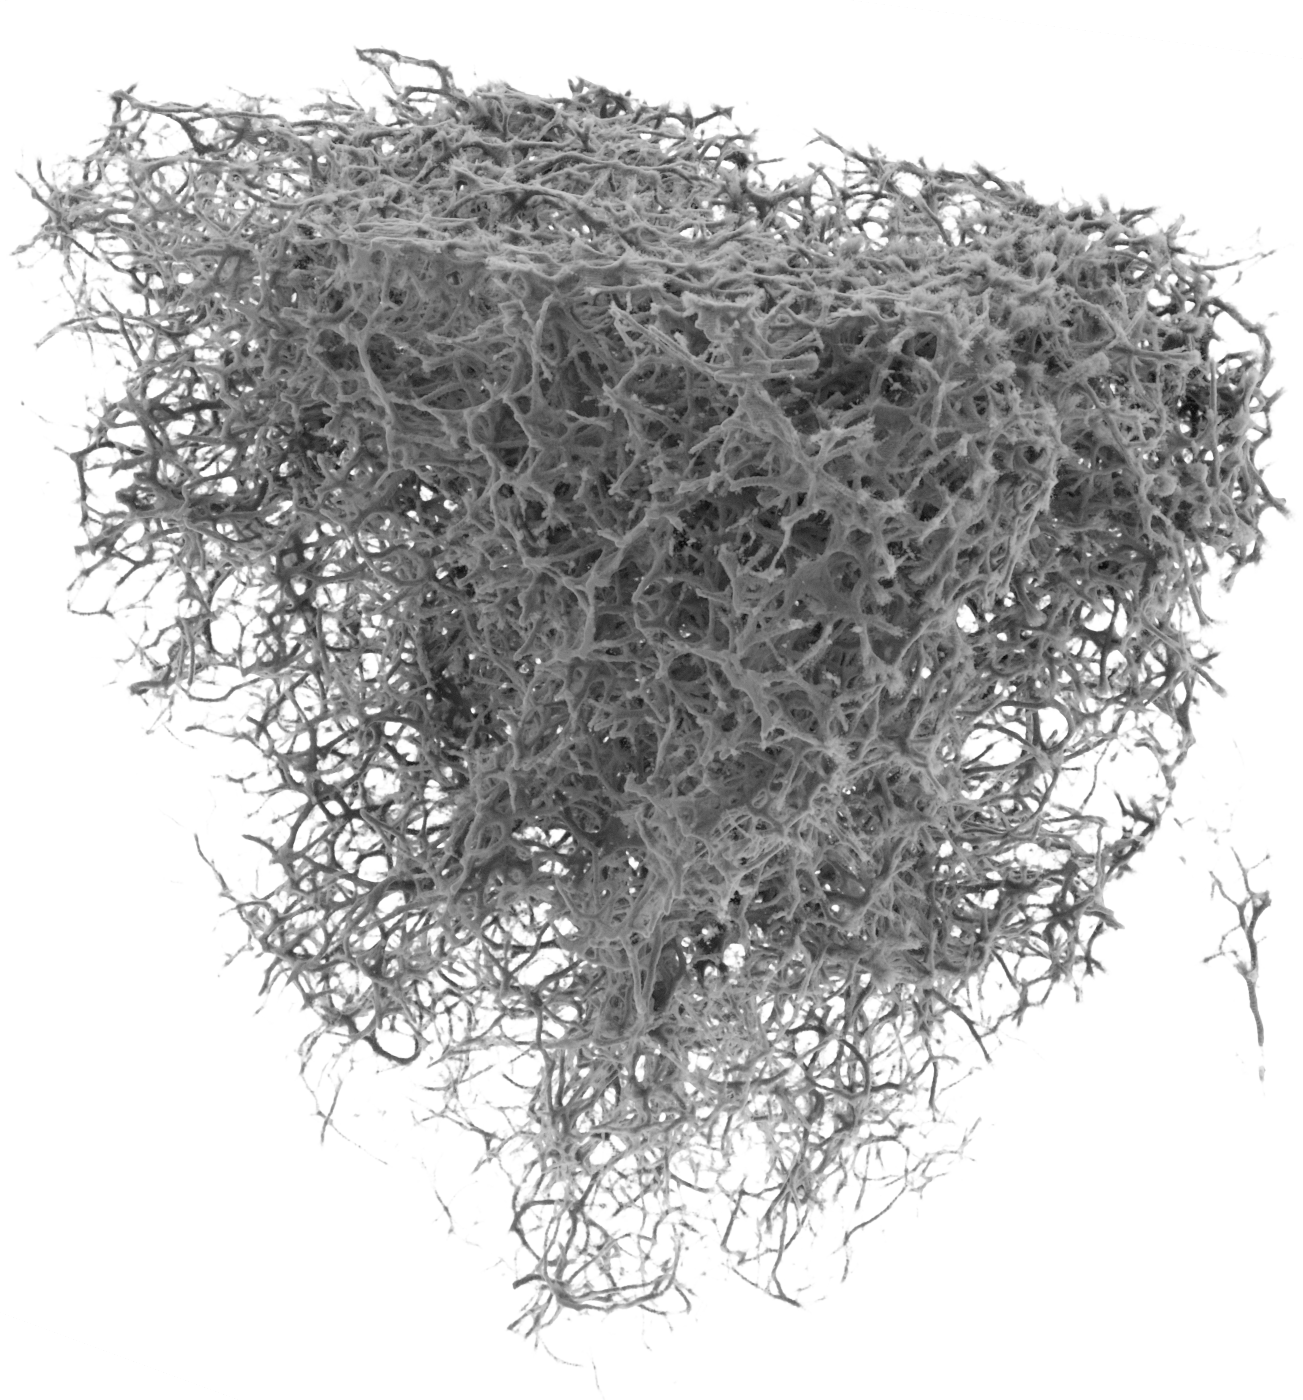
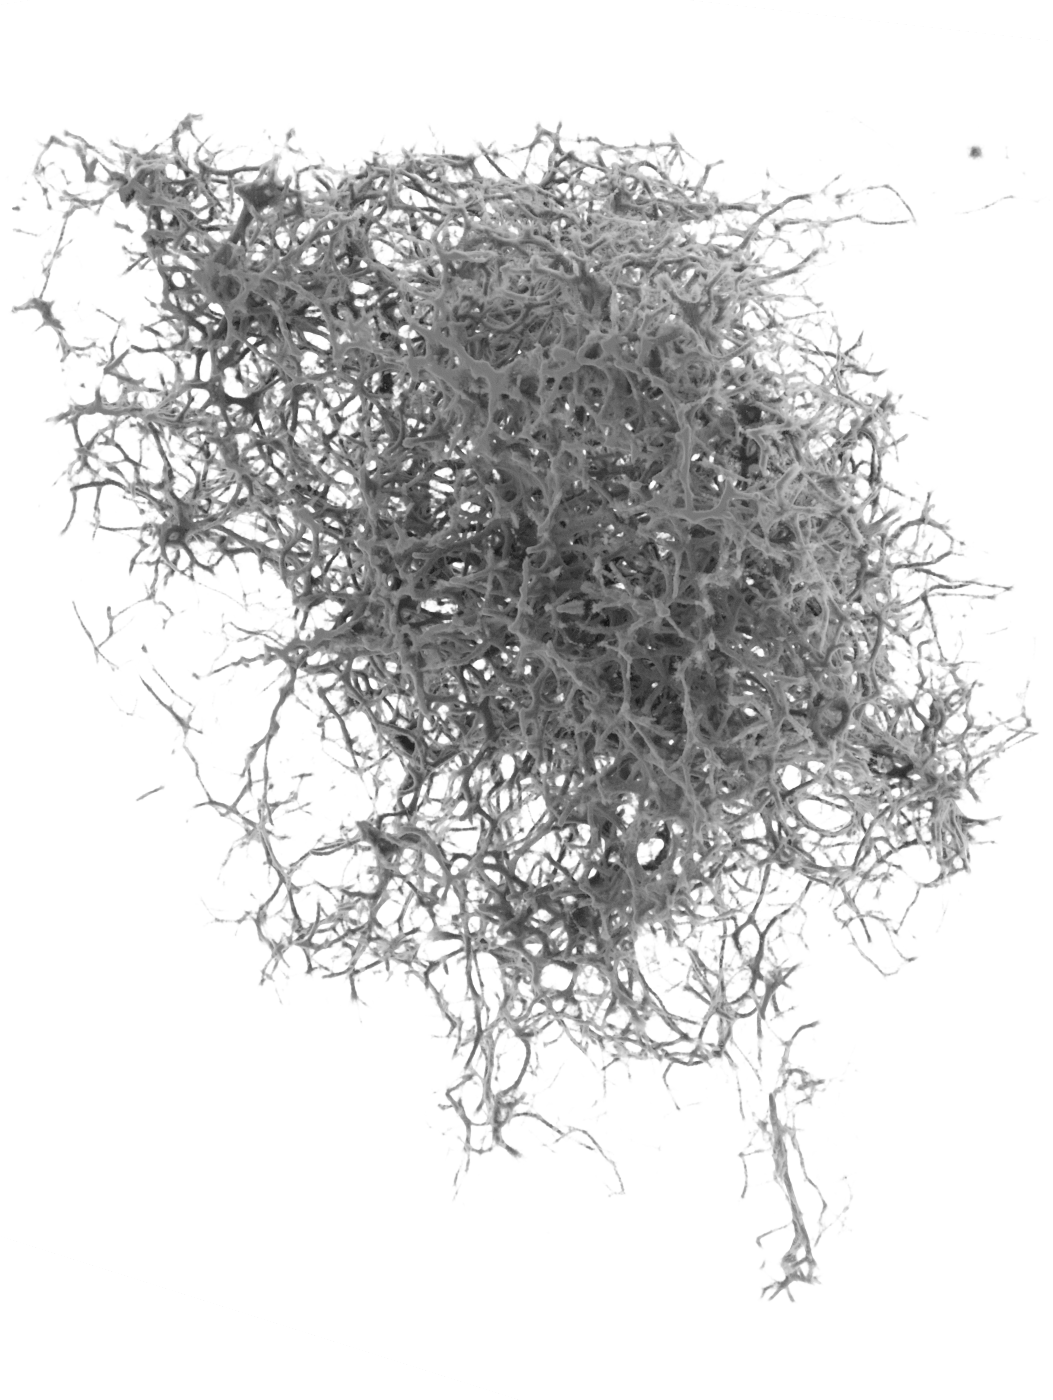
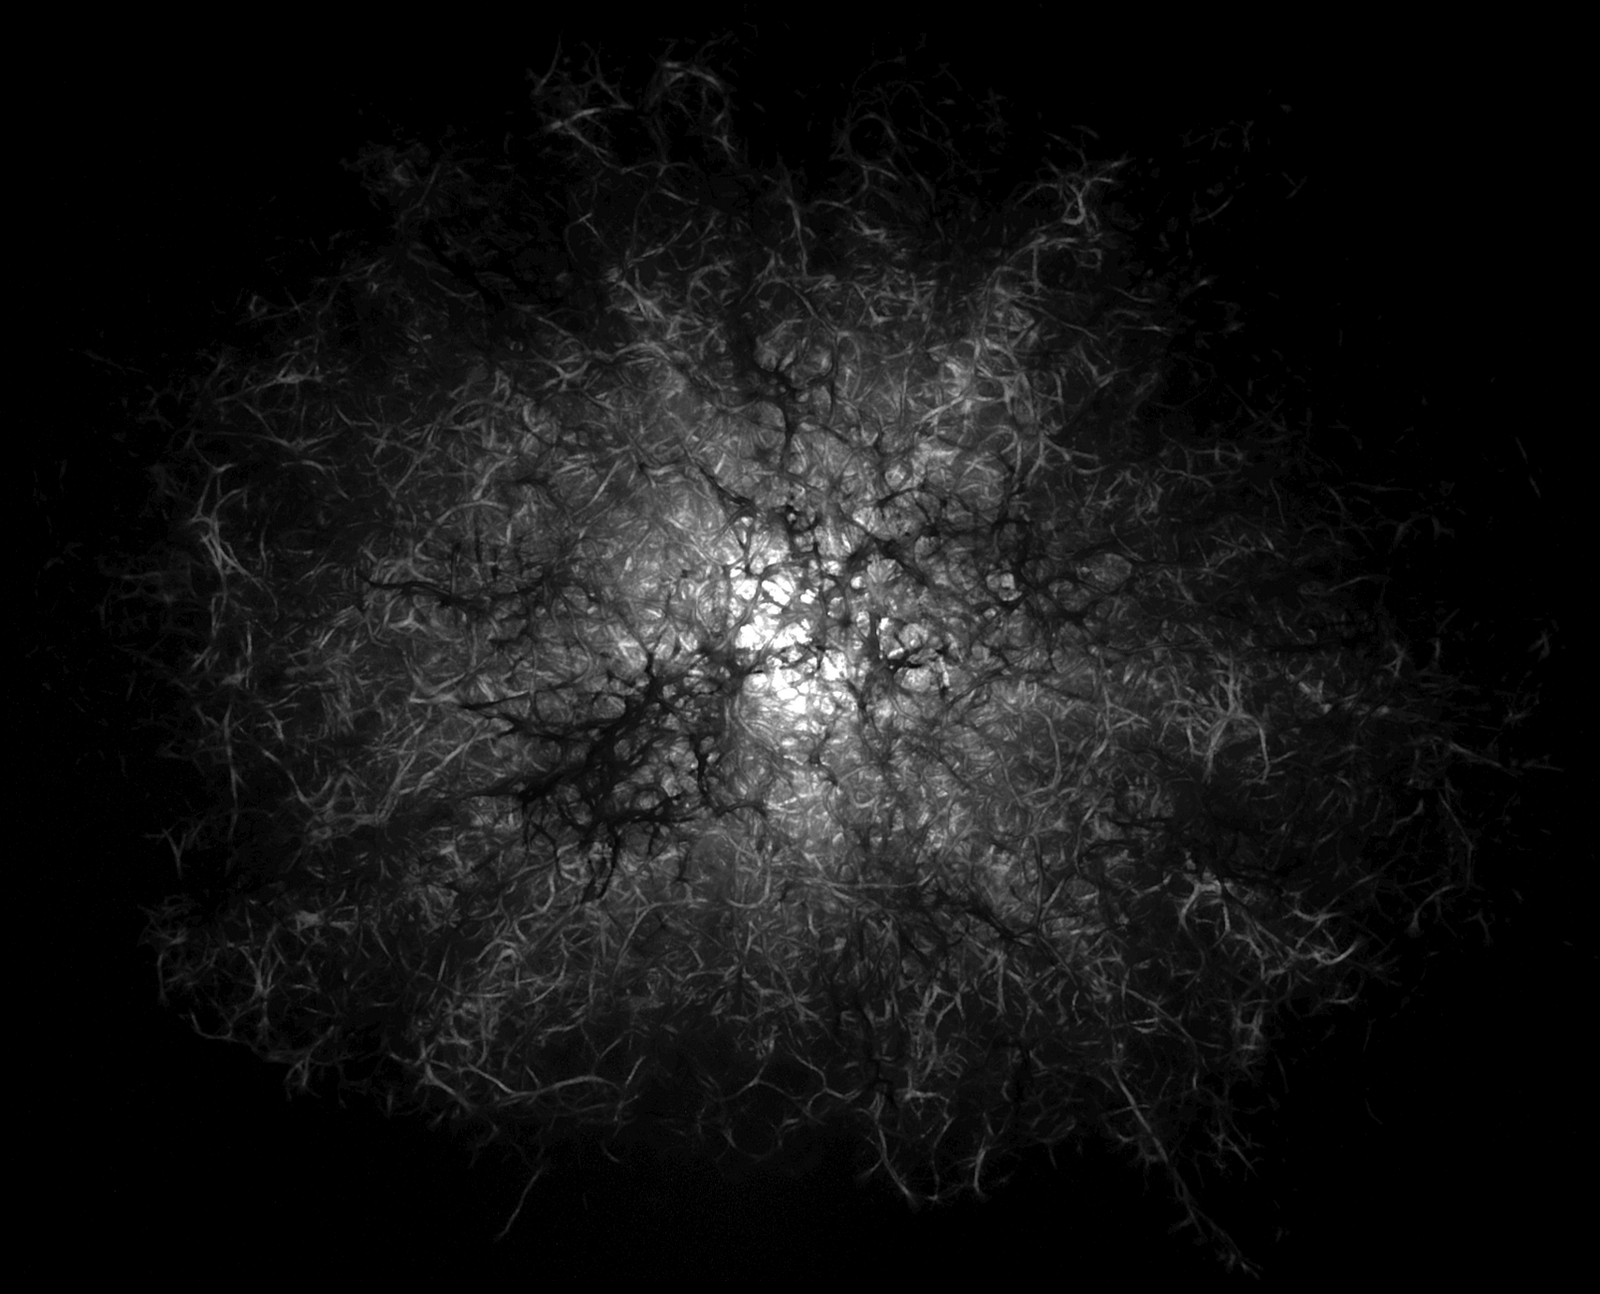
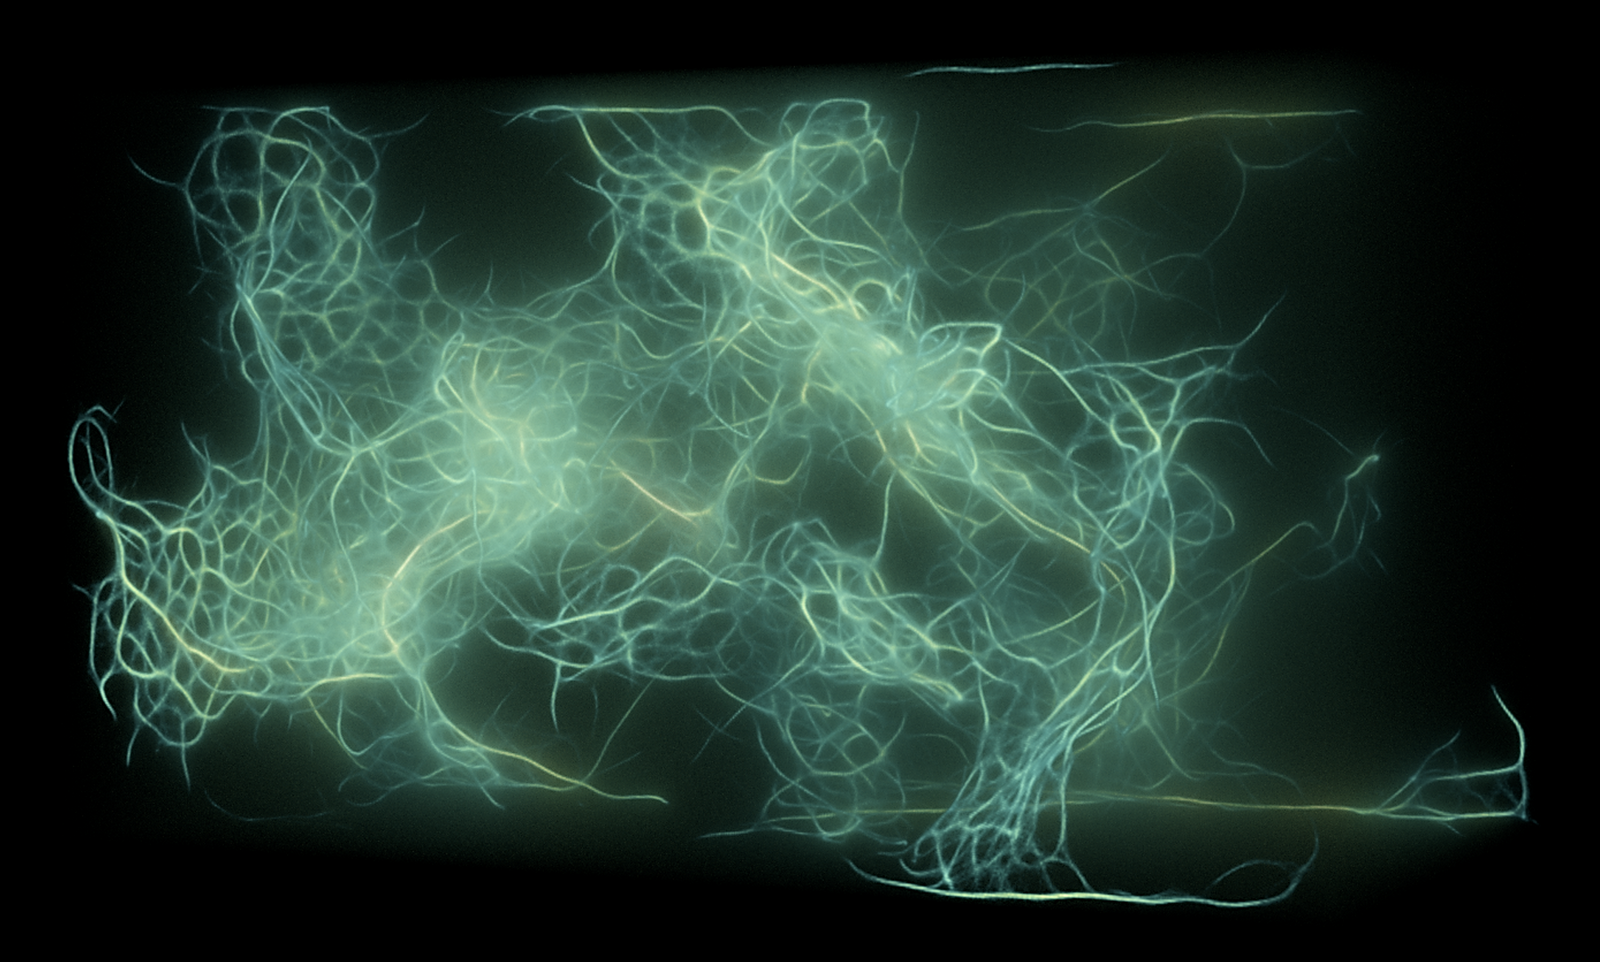
Monte Carlo ​Physarum Machine simulated in a three-dimensional transparent enclosure, at this point without any data to constrain its growth.

The value of this project comes from its interdisciplinary nature. By documenting its story through the lens of visualizations, we wish to inspire the curiosity to explore new connections between different scientific disciplines. We also hope that our story will be useful to those who aspire to invent other such methods, in the quest to understand the world both above and below.

Physarum networks

Physarum polycephalum ​‘slime mold’ is a unicellular protist, whose macroscopic plasmodium form grows complex transport networks in the search for food sources. The near-optimality of these captivating structures has been demonstrated by numerous researchers, for instance in mapping out the greater Tokyo railway system [Tero2010].

In our case, the possibility of reconstructing the Cosmic web by a Physarum simulation (usually referred to as ‘Physarum machine’) has been inspired by the work of Sage Jenson [Jenson2020], who has created GPU-accelerated interactive visual performances featuring the growth patterns of this organism. We build on the algorithm proposed by Jeff Jones [Jones2010], extending this method to 3D and adopting a probabilistic ruleset to increase the expressiveness and robustness of the model.

Complex transport network of tubes grown by Physarum polycephalum in the search for food. (Image credit: https://bioinformaticaupf.crg.eu)

To illustrate the link between the Cosmic web and Physarum networks, we quote the work of Libeskind et al. [Libeskind2018]: “Filaments appear to be the highways of the Universe, the transport channels along which mass and galaxies get channeled into the higher density cluster regions, and which define the connecting structures between higher density complexes.” Even though the two phenomena arise from very different formation processes, the structures they produce are remarkably similar.

Quasi fractal nature of the Cosmic web: zooming in reveals similarity of structure across multiple scales. These structures are also isotropic, in that the filaments have no dominant orientation.

Structure of the Cosmic web

The Cosmic web is the largest recognized structure in the Universe, composed of filaments that interconnect galaxies into a single, cohesive network. One of the greatest challenges of modern cosmology, this complex self-similar structure is composed of diffuse gas and dark matter filaments with characteristic scales between 1 Mpc and 100s of Mpc in length (by comparison, the Milky Way is 0.03 Mpc in diameter). The matter density of the filaments themselves varies across several orders of magnitude.

Galaxies, halos and filaments

The main challenge in reconstructing the Cosmic web stems from its extremely low matter density: beside a few most prominent filaments, it is virtually invisible to even the most sensitive instruments. Most evidence we have about its distribution is indirect: the apparent alignment of the luminous matter – i.e., galaxies – into higher-level structures, sparse spectroscopic measurements, and of course, supercomputer N-body cosmological simulations. Obtaining even an approximate density distribution from the positions of the luminous tracers alone (see example in the left figure) is therefore of great interest to astronomical science.

The distribution of Cosmic web tracers – galaxies and dark matter halos – merely hints at the underlying Cosmic web structure. Actually recovering it is a challenge due to the sparsity of these tracers. (Click arrows to switch between the observable tracers and the reconstructed structure.)

Monte Carlo Physarum machine

The method we designed to address this challenge is an agent-based model called Monte Carlo Physarum machine (MCPM). The core idea of this model is to simulate a swarm of particle-like agents (in the orders of 10⁶-10​⁷) that navigate the 3D domain in the search of ‘food’ deposited by the input data: in our case, these are galaxies or dark matter clusters called halos. The trajectories of all the agents are superimposed over hundreds of simulation steps in a modality dubbed trace. In the limit, this modality approaches a continuous scalar density field representing the probability of finding an agent in any given 3D location.

The propagation step is executed over all agents in parallel and consists of three phases illustrated in the diagram below: directional sensing (looking for sources of deposit), directional mutation (changing the direction of agent propagation based on detected levels of data deposit) and movement (updating the agent position). All these decisions are stochastic, hence the ‘Monte Carlo’ moniker.

A single iteration of the algorithm consists of a propagation step and a relaxation step. These are specified by pseudocode below and explained further.

The relaxation step is executed over all cells of the deposit and trace fields in parallel. Its job is to spatially diffuse the data-emitted deposit so that the agents can detect it and navigate towards the data. The data are represented by agents that do not move, just emit the deposit in every iteration.

(c) Movement

(b) Mutation

(a) Sensing

Alternating the propagation and relaxation steps yields a random walk for every agent (see below). The agent is navigated towards data-emitted deposit (gray) and leaves trace (green). The trace then represents the reconstructed scalar density field: in the case of our main task, the large scale structure of Cosmic web.

Spreading the slime

The process of growing virtual Physarum is iterative and typically takes 1-2 minutes to converge, depending on the resolution of the deposit & trace fields and the number of agents. Detailed performance figures are provided in [Elek2021].

We initiate the MCPM agents simultaneously at a number of sites corresponding to the positions of the data – galaxies or dark matter halos. Unlike the actual Physarum nuclei, the virtual agents are not physically constrained to the plasmodium membrane. Rather, they flow freely through space, incrementally building the resulting trace. The figure shows several snapshots of this process over 500 iterations of the model.

The growing procedure is fully interactive, therefore all of the MCPM parameters related to the generated network geometry can be modified to improve the quality of the reconstruction. Thanks to this design choice, a typical fitting session usually takes only about 10-20 minutes.

Self-patterning

Even without structured input data, MCPM remains true to its biological inspiration and builds three-dimensional networks with organic qualities. The first specimen resembling a tree rhizome has been grown without any data; the structure arises purely from the agents coalescing together (specifically, due to the positive feedback behavior of the agent mutation). To grow the second specimen, we fed the model a random set of 4k points with weights biased upward. The result resembles a rigid scaffolding, such as bone marrow.

Pilot experiments: EAGLE data

The EAGLE simulation catalog [Schaye2015] was our first experiment with actual astrophysical data. These is a relatively small but detailed dataset, mapping the baryonic matter distribution on the level of several adjacent galactic clusters. 

These data served a calibration purpose, to verify that MCPM can find structures on different spatial scales and distinguish between density regimes: filament cores, filament outskirts, and diffuse medium surrounding them. See examples below.

MCPM fit to the EAGLE data on a coarse scale. The left panel shows the overall density distribution, the right panel highlights the three different density regimes of interest. (Click arrows to switch between views.)

MCPM fit to the EAGLE data on a fine scale, obtained from the previous configuration by a single parameter change. Further structure is revealed. (Click arrows to switch between views.)

Calibrating the model: Bolshoi-Planck data

In this experiment we fit to the Bolshoi-Planck dark matter simulation data [Klypin2016] to calibrate MCPM’s geometric parameters. We chose this dataset because 1) it is complete, i.e., no data are missing for observational reasons and 2) the dark matter distribution is geometrically simpler, as it is not subject to electromagnetic interaction, only the gravitational force.

Fitting to the dark matter halo catalog (containing 16 million halos), we find the best match to the reference density field accompanying the simulation, tuning MCPM's directional parameters, agent sensing distance, and filament sharpness. The resulting fit contains all the expected features: filamentary structures on multiple scales, separated by large empty regions called voids. Critically, our analysis confirms [Elek2022] that the reconstruction is positively correlated with the reference density field and therefore suitable as its proxy.

Understanding large simulations

Next we verify that MCPM can recover structures on a very large scale. In this experiment we fit and visualize the MassiveNuS dataset at redshift z=0 (i.e., present day). This is a large dataset of 12M dark matter halos resulting from a cosmological simulation of a 256​³ Mpc region of space [Liu2018].

After fitting the data with Polyphorm we render it with volumetric path tracing. To distinguish between the input dark matter halos and the reconstructed filaments, we use two different emission profiles: white-red for the halos and yellow-blue for the filaments. ​The inner four views correspond to the upper corners of the density cube, while the outer four to the bottom corners. Thus, we obtain a view of the dataset from all directions.

In Burchett et al. [Burchett2020b] we analyze another large-scale simulation: IllustrisTNG [Pillepich2018]. Thanks to Polyphorm, we were able to visualize not only the structure of the Cosmic web, but also the directionality of its filaments and relationship between galactic star formation rates and their relative positions in the structure.

First application to observations: SDSS data for nearby galaxies

Once the MCPM model is calibrated on the reference Bolshoi-Planck data, we proceed with fitting to observational data, specifically the Sloan Digital Sky Survey (SDSS) catalog [Alam2015]. We limit the redshift range (i.e., the distance from Earth) between 0.018 and 0.038 to obtain a consistent coverage of the domain, yielding approximately 37,600 galaxies.

In comparison to fitting simulation data, the added challenge is the incompleteness of these data, due to missing observations of fainter and occluded galaxies – an effect that grows more pronounced with increasing redshift. We also observe unwanted radial artifacts called “Fingers of God” (see the vertical slice), which arise from the uncertainty in measuring the radial component of the galaxies’ velocities.

Nevertheless, MCPM provides a viable reconstruction, which we were able to validate against roughly 550 independent spectroscopic measurements of distant quasar light [Burchett2020a], showing that the absorption signatures of intergalactic gas are statistically correlated with the reconstructed MCPM density fields. An independent verification like this one is critical due to the heuristic nature of our method.

Matter density distribution

Since MCPM produces scalar density fields, we can do more than just identify individual Cosmic web filaments. For instance, we now have the ability to examine their intergalactic medium (IGM) matter distribution profiles as a function of location within each filament.

In this experiment, we visualize a single slice of the 3D Cosmic web map derived from the SDSS data and color-code it into three density regimes: filament cores (red), outskirts of filaments (green) and external diffuse regions (blue). Probing the green regions further (bottom insets) we can further distinguish its individual layers as a function of distance from the galactic halos. These regions are of particular astronomical interest, as they lie in the transition between the well explored circumgalactic environments and the vast extragalactic space.

Physically based rendering

To improve the visual presentation, the generated scalar density fields can be interpreted as volumetric (participating) media. To the deposit and trace fields produced by MCPM we apply custom transfer functions to produce absorption, scattering and emission fields.

We maintain monochromatic absorption and scattering to provide an unambiguous representation of the overall filamentary geometry, and apply color palettes for the emission distribution to distinguish regions with different densities.

The images below were rendered with physically based Monte Carlo path tracer built directly into Polyphorm. Each pair uses two different density multipliers and a custom emission color profile (horizontal bars) to achieve different affect.

Squishy yellow blob

With the capability to create physically based visualizations of MCPM simulations, we have developed an appearance model mimicking the actual slime mold [Mori2021]. We call it Slimex. Using Slimex to render the SDSS dataset, we get an unprecedented view of these cosmic structures. Carefully combining translucency, glossiness, and depth of field, the perceived scale changes from massive to that of a detailed macro shot.

Building on this contrast of scales, we created an interactive artwork titled Physarum Telam. In it, we juxtapose two distinct visualization styles ​– the standard volume rendering technique MIP, and the Slimex model. ​Given that visual style impacts our reading of computer-visualized data so much, how many scientific decisions are impacted by arbitrary aesthetic choices? Can we hope to someday create canonical rendering formalisms that rid us of these ambiguities?

Going big: Extended SDSS galaxy catalog

All preceding SDSS visualizations correspond to relatively small redshift ranges (i.e., distances from Earth) and numbers of fitted galaxies: 37.6k galaxies in redshifts between 0.018 and 0.038. ​In this experiment, we fit to 325k galaxies from the SDSS catalog, up to redshift of 0.1, which corresponds to more than a billion light years of Cosmic distance. At these scales, our ability to observe galaxies diminishes significantly. To obtain viable reconstructions with MCPM, adjusting the sensing distance parameter is necessary – we need double the value compared to the smaller dataset (5 Mpc instead of 2.5 Mpc).

The visualization below slices the reconstructed density field into 3 vertical sections. To emphasize the geometric structure, we disable the emission of the medium itself, and instead illuminate it with a constant omnidirectional white light field. To further enhance the structural contrast, we use a high optical density and a relatively low scattering albedo of 0.4.

Being able to work with such large sets of galaxies, our team has compiled a novel catalog of the Cosmic web densities estimated by MCPM. This catalog includes over ~325k SDSS galaxies up to the redshift of 0.1 as well as ~380k galaxies from the LRG dataset with redshifts up to 0.5. The data are publicly available as part of the seventeenth data release of the Sloan Digital Sky Survey [Abdurro’uf2022].

Fast radio bursts

Fast radio bursts, or FRBs, are strong and extremely short (around 1 ms) flashes of electromagnetic radiation spreading through space on intergalactic scales. Discovered only about a decade ago, they are one of the active topics of inquiry in both theoretical and observational astronomy.

The adjacent visualization recreates the hypothetical situation of what an FRB would look like, were it emitted in visible light rather than the much longer radio waves. We see that due to occlusions by the Cosmic web structures the FRB radiation spreads through space very unevenly. Thanks to Polyphorm, we were able to both reconstruct the Cosmic web structure surrounding this virtual FRB and visualize the situation in a physically plausible way.

In our recent work [Simha2020], we used Polyphorm to reconstruct the Cosmic web towards a particular FRB codenamed 190608 (derived from the observation date). In this visualization, the red line represents a sightline towards the FRB, which originated in a galaxy at redshift ~0.11. Using the MCPM reconstruction, it was possible to explain the unusually large dispersion measure detected for this FRB, as a consequence of an increased density of the Cosmic web that lies between us and the event (as seen in the right part of this diagram).

Moving forward: The future of Polyphorm and MCPM

By combining the pipelines of interactive visualization and bio-inspired simulation, we have built Polyphorm, a software tool that has proven useful for astronomical inquiry. In addition, through its very functioning it points out the similarities between apparently different natural phenomena.

Even though we conclude this document here, the project of Polyphorm continues. We are porting the software to Python under the codename PolyPhy, to reach a wider audience of users from across astronomical sciences and beyond. We are excited about the prospect of connecting multiple disciplines through the framework of MCPM, primarily neuroscience and computational linguistics (see figure).

Auto-stereoscopic rendering of the MCPM fit to the Word2Vec language embedding data [Zhou2020]. All 300k words and phrases contained in Word2Vec (representing the Wikipedia 2017 corpus) are projected from the original 512-dimensional embedding space down to 3D using UMAP dimensionality reduction (red clusters), and then reconstructed with MCPM (yellow-cyan gradient). The result reveals a complex network interconnecting the main central cluster, as well as a number of smaller, isolated clusters. The structure  can be seen in 3D by crossing eyes until the two halves merge.

References
  1. Abdurro’uf et al., 2022. The Seventeenth data release of the Sloan Digital Sky Surveys: Complete Release of MaNGA, MaStar and APOGEE-2 DATA, submitted to Astrophysical Journal Letters
  2. Alam S., Albareti F. D., Prieto C. A., Anders F., Anderson S. F. et al., 2015. The eleventh and twelfth data releases of the Sloan Digital Sky Survey: Final data from SDSS-III, The Astrophysical Journal Supplement Series (219)
  3. Burchett J. N., Elek O., Tejos N., Prochaska J. X., Tripp T. M., Bordoloi R. and Forbes A. G., 2020. Revealing the dark threads of the Cosmic web, The Astrophysical Journal Letters (891)
  4. Burchett J. N., Abramov D., Elek O. and Forbes A. G., 2020. Volumetric reconstruction for interactive analysis of the Cosmic web, IEEE Vis Astro data challenge
  5. Elek O., Burchett J. N., Prochaska J. X. and Forbes A. G., 2021. Polyphorm: Structural analysis of cosmological datasets via interactive Physarum polycephalum visualization, Transactions of Visualization and Computer Graphics (27)
  6. Elek O., Burchett J. N., Prochaska J. X. and Forbes A. G., 2022. Monte Carlo Physarum Machine: Characteristics of Pattern Formation in Continuous Stochastic Transport Networks, Artificial Life (early online access)
  7. Jenson S. and Kuksenok K., 2020. Exploratory modelling with speculative complex biological systems, Proceedings of xCoAx
  8. Jones J., 2010. Characteristics of pattern formation and evolution in approximations of physarum transport networks, Artificial Life (16)
  9. Klypin A., Yepes G., Gottlöber S., Prada F. and Hess S., 2016. MultiDark simulations: The story of dark matter halo concentrations and density profiles, Monthly Notices of the Royal Astronomical Society (457)
  10. Libeskind N. I., van de Weygaert R., Cautun M., Falck B., Tempel E., Abel T. et al., 2018. Tracing the cosmic web, Monthly Notices of the Royal Astronomical Society (473)
  11. Liu J., Bird S., Zorrilla M. J. M., Hill J. C., Haiman Z., Madhavacheril M. S., Petri A. and Spergel D. N., 2018. MassiveNuS: cosmological massive neutrino simulations, Journal of Cosmology and Astroparticle Physics (49)
  12. Mori I., Elek O., Burchett J. N. and Forbes A. G., 2021. Physarum Telam, Artificial Life artworks
  13. Pillepich A., Springel V., Nelson D., Genel S., Naiman J., Pakmor R. et al., 2018Simulating galaxy formation with the IllustrisTNG model, Monthly Notices of the Royal Astronomical Society (473)
  14. Schaye J., Crain R. A., Bower R. G., Furlong M., Schaller M., Theuns T. et al., 2015. The EAGLE project: Simulating the evolution and assembly of galaxies and their environments, Monthly Notices of the Royal Astronomical Society (446)
  15. Simha S., Burchett J. N., Prochaska J. X., Chittidi J. S., Elek O., Tejos N. et al., 2020. Disentangling the Cosmic Web toward FRB 190608, The Astrophysical Journal (901)
  16. Tero A., Takagi S., Saigusa T., Ito K., Bebber D. P., Fricker M. D., Yumiki K., Kobayashi R. and Nakagaki T., 2010. Rules for biologically inspired adaptive network design, Science (327)
  17. Zhou H., Elek O., Anand P. and Forbes A. G., 2020. Bio-inspired structure identification in language embeddings, Proceedings of Vis4DH